How to layout the header of a panel app?

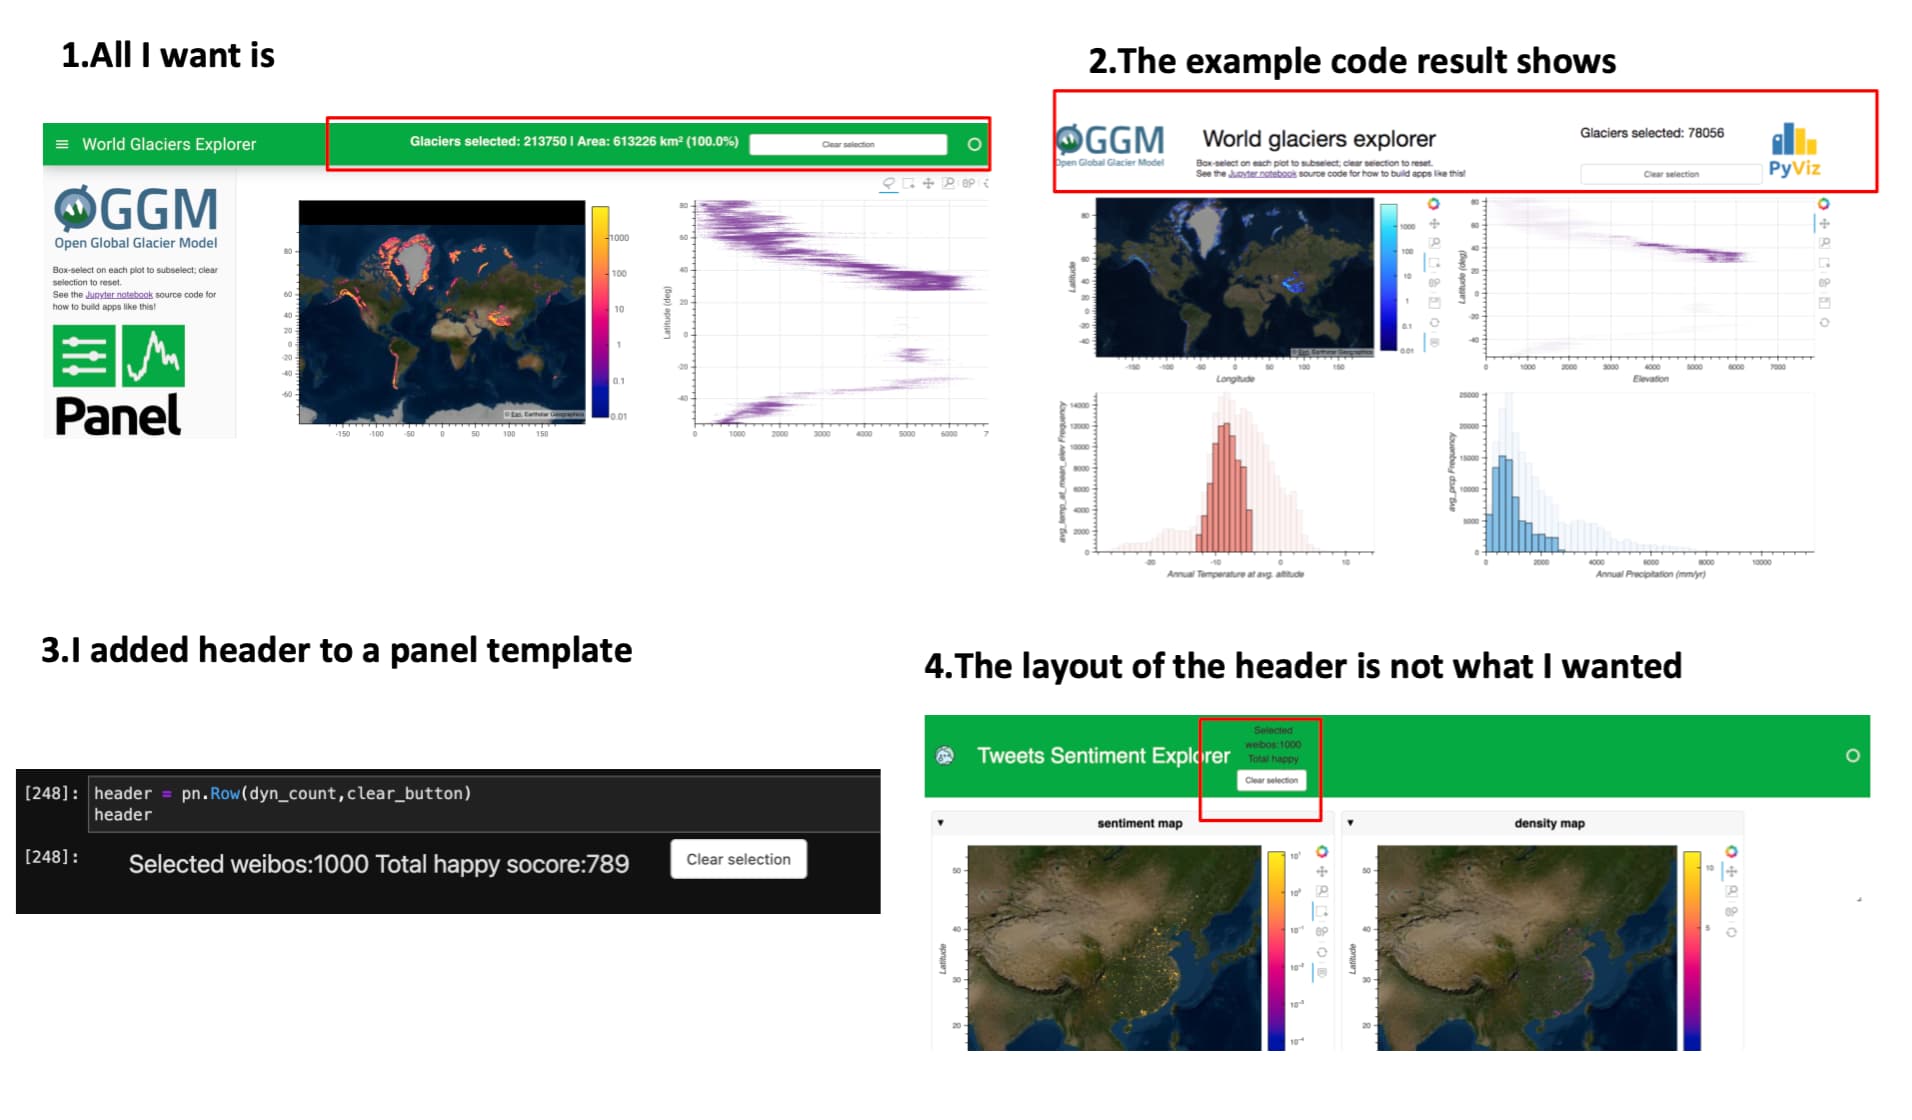
I followed the glaciers example to build my first panel app. This example/live app refers to a Github link that contains the example code. However, there are different between the online app and the source code’s final result. The online version has a header bar and a slider panel, which the Github link’s final result doesn’t. See blew fig1, 2,

I try to use panel template to add the header by,


header = pn.Row(dyn_count,clear_button)
flt = pn.template.ReactTemplate(
                                    title='Tweets Sentiment Explorer',
                                   # header_background="F5F4EF",
                                   header = header,
                                  main= pn.Column(
                          pn.Row(pn.Card(geomap,title="sentiment map"),pn.Card(nu,title="density map")),
                           pn.Row(pn.Card(temperature,title="tweets counts"),pn.Card(precipitation,title = "sentimet distribution")))
              
                     ) 
flt.servable()

The header itself is shown in fig 3. When I served this app. I got fig 4.
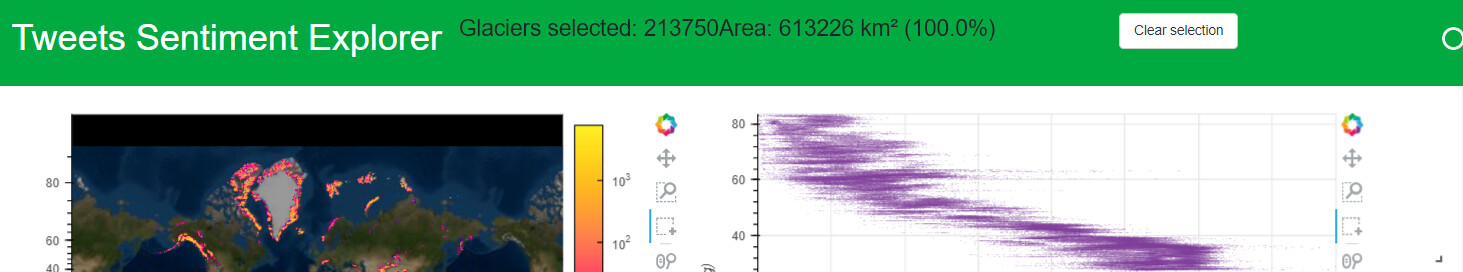
I really want the text and the button in one row in the header so hard, but I have been stuck here for a while, can someone tell me how to layout them in panel? Thanks!

maybe you need to add

pn.config.sizing_mode = 'stretch_width' 

or in the row includef in the header pn.Row(dyn_count,clear_button, sizing_mode='stretch_width'). by default the components have a fixed size, so you need to tell them occupy all the available width.

Hi, it not works, see below,


By the way, here is my dyn_count and clear_button's definitions,

def count(data): return hv.Div('<p style="font-size:20px">Selected weibos:{}'.format(len(data)) +  ' Total happy socore:{:.0f}</p>'.format(np.sum(data['sentiment_scores_1']))).options(height=40)

dyn_count =           dyn_data.apply(count)


clear_button = pn.widgets.Button(name='Clear selection',width=5,margin=(0,0),width_policy="fixed",max_width=6)


the installation for the example with the geos packages is really difficult, sorry I can not help you more. Someone will help you for sure. It is easier if you put some minimum reproducible example for the problem you are facing.

best regards,
N

Can panel be used in Google colab?

Yes, and it’s installed by default.

I got this, but my css skills are not good. It needs some work yet. I added flex element to the header-items container css - HTML Align DIV Children Horizontally - Stack Overflow

css = """
#header-items {
    display: flex;
    flex-wrap: nowrap;
    flex-direction: row ; 
    justify-content:  space-between;;  
}

#header-items > .bk-root:first-of-type {
    width: 50% !important;
}

#header-items > .bk-root:nth-last-of-type(1) {
    width: 125px !important;
    align:right;
}


"""

def count(data): return hv.Div('<p style="font-size:20px ">Glaciers selected: {}'.format(len(data)) + 
                               'Area: {:.0f} km² ({:.1f}%)</font>'.format(np.sum(data['area_km2']), np.sum(data['area_km2']) / total_area * 100)).options(height=40)

pn.config.raw_css.append(css) 

header = pn.Row(dyn_count, 
                clear_button)

flt = pn.template.ReactTemplate(
                                  title='Tweets Sentiment Explorer',
                                  header = header,
                                  main= pn.Column( pn.Row(geomap, elevation), pn.Row(temperature, precipitation))
) 
              
flt.show()
1 Like

That’s AWESOME. Even the header looks not as good as the example shown here. But still that really good!

It’s hard to get this example to work in colab for some reason. The kernel seems to crash when showing the rasterized points.

I also wondering if the example shown/hosted in pyvis/anaconda, can someone share the exact code of that example?