How to make a HoloMap nested inside a DynamicMap behave intuitively?

Context: I have a parametrised function that spits out data which I want to visualise live (using a DynamicMap). For some of the parameters, the evaluation is dramatically more efficient overall if supplied with a vector of all the values I’m interested in than it would be to evaluate for those values one-by-one. The most obvious solution to me is to have an outer layer of parameters that should trigger a reevaluation in the DynamicMap, and an inner HoloMap which lets me scrub through the pre-computed values.

However, when I try to do this I get the warning No plotting class for HoloMap found. I can visualise the resultant DynamicMap using e.g. the .layout() method, but I want it to look as if all the parameters were treated the same.

That came out really garbled, so here’s some examples to explain what I mean. I want to make test_dynamicmap produce the same output that test_holomap() does. test_dynamicmap.layout() gets me halfway there, but I don’t want three plots next to each other, I want one plot with a widget.

phases = [0, 1, 2]
frequencies = [0.5, 0.75, 1.0, 1.25]

def sine_curve(phase, freq):
    xvals = [0.1* i for i in range(100)]
    return hv.Curve((xvals, [np.sin(phase+freq*x) for x in xvals]))

def test_holomap1():
    curve_dict = {(p,f):sine_curve(p,f) for p in phases for f in frequencies}
    hmap = hv.HoloMap(curve_dict, kdims=['phase', 'frequency'])
    return hmap

def test_holomap2(phase):
    curve_dict = {f:sine_curve(phase,f) for f in frequencies}
    hmap = hv.HoloMap(curve_dict, kdims='frequency')
    return hmap

test_dynamicmap = hv.DynamicMap(test_holomap2, kdims=['Phase']).redim.values(Phase=phases)
Hey there. I’m a little unclear on what exactly you want. But if you change the Holomap to a NdOverlay, you can have all the frequency lines stacked with the phase as a widget (see code below). Or did you still want both the freq and phase widgets with this approach (nested hmap in a dmap) and for it to show a single line at a time? I don’t think that is possible.

phases = [0, 1, 2]
frequencies = [0.5, 0.75, 1.0, 1.25]

def sine_curve(phase, freq):
    xvals = [0.1* i for i in range(100)]
    return hv.Curve((xvals, [np.sin(phase+freq*x) for x in xvals]))

def test_holomap2(phase):
    curve_dict = {f:sine_curve(phase,f) for f in frequencies}
    hmap = hv.NdOverlay(curve_dict, kdims=['frequency'])
    return hmap

test_dynamicmap = hv.DynamicMap(test_holomap2, kdims=['Phase']).redim.values(Phase=phases)

Hey, thanks for your help. Yes, I want both widgets available and only a single line. I’m not married to the hmap-in-dmap approach, that just seemed naively the way to get what I want - if you have an alternative suggestion for how to do it, I am open.

Specifically what I want is:

  • have both phase and freq widgets in the visualisation
  • perform the computation for every freq on moving the phase widget
  • do not call the function passed to hv.DynamicMap on moving the freq widget, because that data is already computed

There is a related problem that I am trying to solve, which is:

  • I have a function which returns two datasets, A and B
  • I want to choose which dataset I visualise in a dmap from a drop-down menu (not both at once)
  • I don’t want to call the function once for each dataset, because actually both are returned with a single function call

Hi @AQ18,

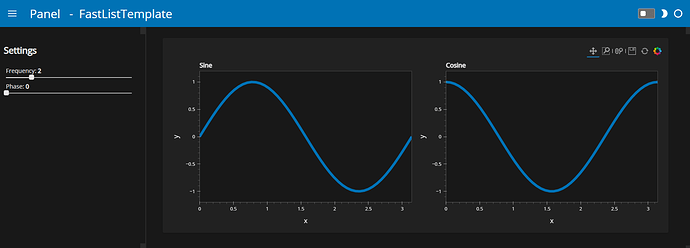
It kind of reads your looking for what is in this template on the panel website ref gallery, you have the widgets on screen and update the appropriate binded graph when manipulated. Not sure about the third point. Maybe can be used as starting point if not already viewed

https://panel.holoviz.org/reference/templates/FastListTemplate.html#templates-gallery-fastlisttemplate

Maybe combine it with @Marc 's work found here that allows you to load the data sets and then select between them from a drop down

https://discourse.holoviz.org/t/how-to-create-multiple-instances-of-object-and-display-methods/3157/2

Hope of some help

Hey @carl,

Thanks for your suggestions. I’m not very familiar with Panel but I don’t think this addresses my problem. I’m basically happy with the appearance of the visualisation that hv.DynamicMap produces by default, it’s the underlying behaviour of calling the function for every new parameter set which I want to modify, and the example in your first link still does that.

As for your second link, I think I can see how that could be extended to my use case, where every time the dmap updates, it stores the different datasets under a selector parameter… I’m really hoping for a less involved approach though!

I managed to code up a workaround for my dummy sine wave problem:

xvals = [0.1* i for i in range(100)]
phases = [0, 1, 2]
frequencies = [0.5, 0.75, 1.0, 1.25]

class lazy_sine_curve:
    
    def __init__(self, xvals, phases):
        self.xvals = xvals
        self.phases = phases
        self._cache = {}
        
    def __call__(self, phase, frequency):
        if frequency not in self._cache:
            self._cache[frequency] = {phase: [np.sin(phase+frequency*x) for x in self.xvals] for phase in self.phases}
            
        return hv.Curve((xvals, self._cache[frequency][phase]))

sine_curve = lazy_sine_curve(xvals, phases)

dmap = hv.DynamicMap(sine_curve, kdims=['Phase', 'Frequency']).redim.values(Phase=phases, Frequency=frequencies)

Because my lazy_sine_curve caches the result for all phases for every new frequency, it doesn’t need to do any new computations when I move the phase slider widget.

Coming up with this solution helped me realise what I really wanted. Because the DynamicMap already has its own cache:

dmap.data
# OrderedDict([((0, 0.5), :Curve   [x]   (y)), ((0, 0.75), :Curve   [x]   (y))])

Here the cache has stored the Curves for (Phase=0, Frequency=0.5) and (Phase=0, Frequency=0.75), because I created the dmap and then moved the Frequency widget one tick over. But actually, the data for all the phases at those frequencies has already been computed. Rather than storing that data in a cache in a custom class, it would be great if I could store it in the dmap’s cache, so that on creation we would already have

dmap.data
# OrderedDict([((0, 0.5), :Curve   [x]   (y)),
#              ((1, 0.5), :Curve   [x]   (y)),
#              ((2, 0.5), :Curve   [x]   (y))])

This is what I naively hoped that nesting a HoloMap inside a DynamicMap would do by default. Does anyone have any thoughts on how to do this?