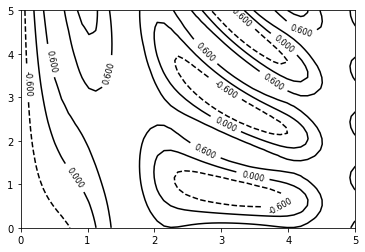
I’m trying, using hvplot and xarray, to make a contour plot like this matplotlib example (see cell 8):
def f(x, y):
    return np.sin(x) ** 10 + np.cos(10 + y * x) * np.cos(x)
x = np.linspace(0, 5, 50)
y = np.linspace(0, 5, 40)

X, Y = np.meshgrid(x, y)
Z = f(X, Y)

contours = plt.contour(X, Y, Z, 3, colors='black')
plt.clabel(contours, inline=True, fontsize=8)
print(contours)
I’ve managed to get rid of the colorbar, but I’m not finding a way to set all the contours to black and label them with text. I’ve tried:
from matplotlib.colors import ListedColormap
ds_dummy = xr.Dataset({'elevation': (['x', 'y'],  Z)},
                coords={'lon': (['x', 'y'], X),
                         'lat': (['x', 'y'], Y)})
black = np.zeros((1, 4))
cmap_black = ListedColormap(black)
hv_contours = ds_dummy.hvplot.contour('lon', 'lat', 'elevation').opts(cmap=cmap_black,
                                                                     colorbar=False)
hv_contours
This produces a blank plot. Replacing cmap_black with “RdBu” gets the contours back, in reds and blues.
Is there some way to extract the matplotlib.contour.QuadContourSet from hv_contours to pass to one of matplotlib’s labeling functions?