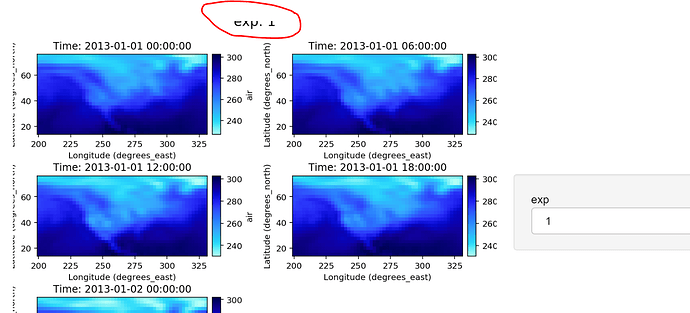
import xarray as xr
import hvplot.xarray
ds = xr.tutorial.open_dataset('air_temperature').isel(time=slice(0, 5))
ds = xr.concat([ds.assign_coords(**{'exp': '1'}), ds.assign_coords(**{'exp': '2'})], 'exp')
ds['air'].attrs =  {}
ds.hvplot('lon', 'lat').layout('time').cols(2).opts(fig_bounds=(0.05, 0.05, 0.93, 0.93))
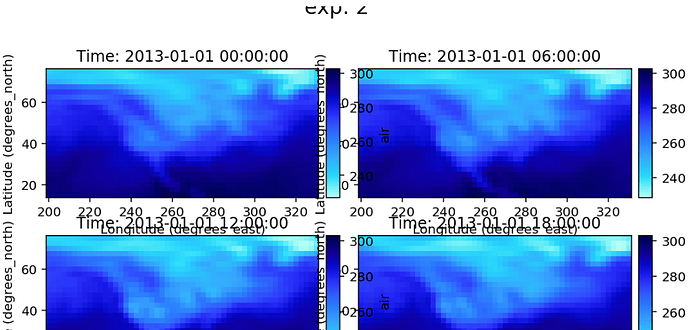
I tried tight padding, but no avail:
import xarray as xr
import hvplot.xarray
ds = xr.tutorial.open_dataset('air_temperature').isel(time=slice(0, 5))
ds = xr.concat([ds.assign_coords(**{'exp': '1'}), ds.assign_coords(**{'exp': '2'})], 'exp')
ds['air'].attrs =  {}
ds.hvplot('lon', 'lat').layout('time').cols(2).opts(fig_bounds=(0.05, 0.05, 0.93, 0.93), tight=True, tight_padding=1)

