How to overlay two dynamic maps?

Hello.

I have a dynamic map like this containing points from Pandas dataframe (with tooltips for point information), which comes from code like below

url = 'http://a.basemaps.cartocdn.com/rastertiles/voyager/{Z}/{X}/{Y}.png'
attribution = "Tiles by Carto, under CC BY 3.0. Data by OSM, under ODbL"
China = x_range,y_range = ((7827151.696402039,14636773.672271816), (7377090.428741338,2093763.0722344585))
p = figure(tools='pan, wheel_zoom', x_range=x_range, y_range=y_range, 
           x_axis_type="mercator", y_axis_type="mercator")
p.add_tile(WMTSTileSource(url=url, attribution=attribution))
hover =HoverTool()
hover.tooltips = [
    ('', '@{Period Label}'),
    ('Start Date', '@Inception'),
    ('Capital', '@{Capital Label}'),
    ('Capital Coordinates', '@{Capital Coordinates}'),  
]
p.tools.append(hover)
@Longitude and @Latitude for hover.tooltips
p.circle(x='Capital Mercator X', y='Capital Mercator Y', fill_color='red', size=10, source=df)
show(p)

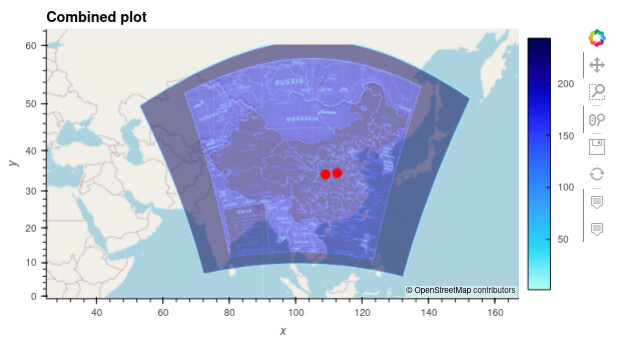
I have another dynamic map containing a georeferrenced raster image (tif) on top of a Open Street Map basemap (with tooltips for coordinates), which comes from a simplified code like below (unfortunately new users can not post two images at a time…so I omit the image here):

hv_tiles_osm = hv.element.tiles.OSM()
dataarray_mercator = rxr.open_rasterio('abc.tif').rio.reproject('EPSG:3857')
dataarray_mercator
hv_dataset_mercator = hv.Dataset(dataarray_mercator[0], vdims=value_dimension, kdims=key_dimensions)
hv_image_mercator = hv.Image(hv_dataset_mercator)
hv_image_custom_hover = hv.Image(hv_dataset_mercator).opts(tools=[custom_hover])
hv.extension('bokeh', logo=False)
hv_dyn_scaled = hd.regrid(hv_image_custom_hover).opts(clim=(min_val, max_val))
hv_combined_scaled = hv_tiles_osm * hv_dyn_scaled
hv_combined_scaled

Provided, I only need point coordinates (and tooltips info) from the first map and plot them on top of the second dynamic map (i.e. raster image and basemap). How can I overlay the two dynamic maps? It would be ideal if I can easily change which basemap to be used, but it is only nice-to-have. Thanks!

Welcome @GO5IT

Can you share a minimal, reproducible example (MRE)?

In general, a complete script that can be copied/pasted and immediately run, as-is, with no modifications. This is much more useful than snippets.

Thank you for your quick reply. I have tried as much as I can here:

Hope this would make sense. If not, please give me a shout.
Thank you very much in advance!

Your example is not very minimal. Try to use fake data and remove all unnecessary parts of the code.

I suggest converting the first example to a holoviews figure instead of using bokeh. Then it should be pretty straightforward to combine the two. If you want a more tailored solution, try to reduce your example.

Thanks. I would like to do what you suggest. I have been learning Bokeh and HoloViw for less than a week, so I am just trying to get into them. I understand Bokeh a bit better, but I even do not know where to look at to convert Bokeh to Holoview figure :sweat_smile:…can you give me a hand for this too?

The code above is just a modified version of two tutorials (one for Bokeh and the other for Holoview), thus I am wondering how to combine/integrate them.

1 Like

I would like to help you, but to help you, I need a working code example I can paste without downloading any package.

Try to create a small example with fake data instead of all the functionality to get the data from the database and google drive.

Try reading this to get an idea of what I’m looking for: Craft Minimal Bug Reports

1 Like

Please give me time to organise this. I need to learn more about Holoviews and Bokeh to provide what you need. If you know how to produce a holoviews figure from dataframe, please point me to an example/tutorial. That will help me to come back here quicker.

1 Like

Don’t focus on the bokeh/holoviews part, I can work with that. Focus on how to make the fake data available to me :slight_smile:

1 Like

So, I made the code a way simpler here Chinese Dynasty Dynamic Maps.ipynb のコピー · GitHub
However, I still don’t know how to share the raster image used in an efficient way.
So, you can download from the URL specified in the code and put it in your environment. My version is done on Google Collab+GoogleDrive. I do not think I can “fake the image”. If this is not enough, please tell me exactly what I can do for you. Thank you!

The raster image (2nd map) looks like this:

Credit: “Map reproduction courtesy of the Norman B. Leventhal Map & Education Center at the Boston Public Library” available from China - Norman B. Leventhal Map & Education Center

I have attached a notebook that generates the following plot. I chose to use hvplot which is based on Holoviews but have an easier interface to work with, in my opinion. hvplot uses Geoviews and Datashader behind the scene in this example. Some

image

4088_chinese-dynasty-dynamic-maps.ipynb (3.9 KB)

Or directly here:

import cartopy.crs as ccrs
import hvplot.pandas
import hvplot.xarray
import pandas as pd
import rioxarray as rxr
from bokeh.models import HoverTool


data = [
    ("TwelveVassals", None, None, None),
    (
        "WangMangperiod",
        "108.858333333 34.308333333",
        12118054.235234,
        4070279.1828400064,
    ),
    (
        "WangMangperiod",
        "108.858333333 34.308333333",
        12118054.235234,
        4070279.1828400064,
    ),
    ("Qindynasty", "108.716667 34.35,12102284.01118189", 4075895.856076398),
    ("Handynasty", "112.42447 34.65867", 12515034.753103662, 4117591.964602804),
]
df = pd.DataFrame(
    data,
    columns=["Period", "CapitalCoordinates", "CapitalMercatorX", "CapitalMercatorY"],
)


hover = HoverTool(
    tooltips=[
        ("", "@{Period}"),
        ("Capital Coordinates", "@{CapitalCoordinates}"),
    ]
)

xlim, ylim = (
    (7827151.696402039, 14636773.672271816),
    (7377090.428741338, 2093763.0722344585),
)

plot_points = df.hvplot.points(
    x="CapitalMercatorX",
    y="CapitalMercatorY",
    crs=ccrs.GOOGLE_MERCATOR,
    color="red",
    size=100,
    hover_cols="all",
    tools=[hover],
)


# Download file here: https://collections.leventhalmap.org/search/commonwealth:3f463903f
da = rxr.open_rasterio(
    "/home/shh/Downloads/commonwealth_3f463903f_image_georectified_primary.tif"
)
da = da.rio.reproject("EPSG:3857")


plot_map = da.sel(band=1).hvplot.image(
    x="x",
    y="y",
    tools=["hover"],
    crs=ccrs.GOOGLE_MERCATOR,
    rasterize=True,  # For speed up in plotting, uses Datashader
    tiles="OSM",
    alpha=0.5,
)
plot_map = plot_map.redim.nodata(value=0)  # Remove 0 from plot


(plot_map * plot_points).opts(title="Combined plot", active_tools=["wheel_zoom"])
1 Like

Looks great. Thank you. Can you list what packages need to be installed?
I got several different errors when I install and/or use your code. They are under investigation now. One being a crash in Google Collab with a message:
ERROR:shapely.geos:Geometry must be a Point or LineString

I’m pretty much running the latest version of the packages though I have installed it through Conda locally on my machine.

Installed:

!pip install cartopy
!pip install hvplot
!pip install pandas
!pip install rioxarray
!pip install bokeh
!pip install geoviews
!pip install datashader

Everything works fine until the last cell and crashed. It seems free Google Collab cannot handle, but do you think the code itself is fine despite the following error when crashed?:

(plot_map * plot_points).opts(title="Combined plot", active_tools=["wheel_zoom"])
ERROR:shapely.geos:Geometry must be a Point or LineString

I have also tried in a local environment, but I got error when importing packages, so I cannot run the code further. It seems there might be dependency problems with xarray and numpy, but not found a solution from the web.

ImportError: cannot import name 'maybe_cast_to_coords_dtype' from 'xarray.core.utils' (/Users/gsugimoto/opt/anaconda3/lib/python3.9/site-packages/xarray/core/utils.py)

It is not your problem but I am stuck with those…

My suggestion is to download Miniconda from here.

And then run the following commands (one at a time):

conda install mamba -c conda-forge -y
mamba create -n example python=3.9 jupyterlab=3 cartopy hvplot pandas rioxarray bokeh geoviews datashader -c conda-forge -y
mamba activate example
jupyterlab
1 Like