Hacked something together, see below. But still interested to know how other people handle these cases where the samples are just very large and can’t be passed directly?
import holoviews as hv
import pandas as pd
hv.extension("bokeh")
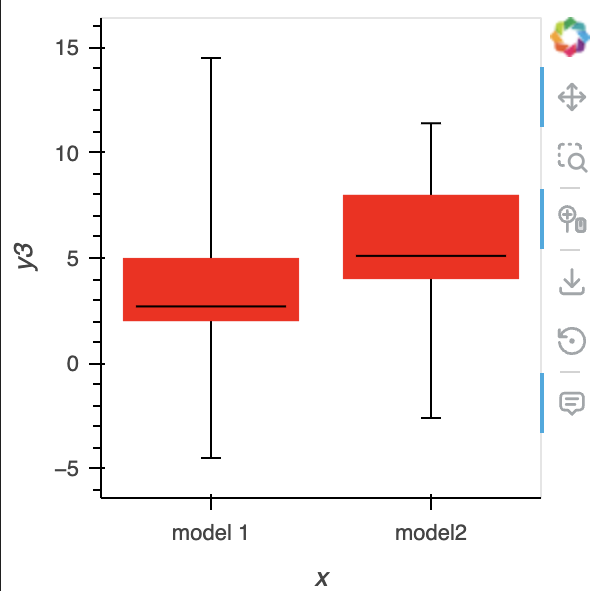
df = pd.DataFrame(
{
"x": ["model 1", "model2"],
# NOTE whiskers
"y1": [-4.5, -2.6],
"y5": [14.5, 11.4],
# NOTE boxes
"y2": [2, 4],
"y4": [5, 8],
# NOTE markers
"y3": [2.7, 5.1],
}
)
z1 = df.assign(errneg=df["y3"] - df["y1"], errpos=df["y5"] - df["y3"])
z2 = df.assign(up=df["y4"] - df["y2"]).melt(
id_vars=["x"], value_vars=["y2", "up"], var_name="pos"
)
whiskers = hv.ErrorBars(z1, kdims=["x"], vdims=["y3", "errneg", "errpos"])
boxes = hv.Bars(z2, kdims=["x", "pos"]).opts(
cmap=["rgba(0,0,0,0)", "red"],
line_width=0,
stacked=True,
multi_level=True,
show_legend=False,
)
markers = hv.Points(df, kdims=["x", "y3"], vdims=["y1", "y2", "y4", "y5"]).opts(
size=75,
marker="dash",
tools=["hover"],
color="k")
X = hv.Overlay([whiskers, boxes, markers])