How to plot two interactive curves on top of each other using two pd.Series?

Hi,

I’m trying to plot to graphs on top of each other. Both should be interactive and updated using widgets. I managed to reproduce the problem with example code taken from here (with some edits).

Non-interactive example

In this non-interactive case everything works as expected.

Code:

import pandas as pd
import hvplot.pandas
import panel as pn

pn.extension(sizing_mode="stretch_width")


def get_data():
    url = "https://data.seattle.gov/api/views/65db-xm6k/rows.csv?accessType=DOWNLOAD"
    file = "rows.csv"
    try:
        seattle_bikes = pd.read_csv(file, parse_dates=["Date"]).set_index("Date")
    except Exception:
        seattle_bikes = pd.read_csv(url, parse_dates=["Date"]).set_index("Date")
        seattle_bikes.to_csv(file)

    bikes = seattle_bikes["Fremont Bridge Sidewalks, south of N 34th St"]
    bikes.name = "data"
    return bikes.to_frame()

seattle_bikes = get_data()
seattle_bikes2 = seattle_bikes.copy()
seattle_bikes2["data"] += 1e2

plot1 = (
    seattle_bikes.resample("D")
    .sum()
    .rolling(50, center=True, win_type="gaussian")
    .sum(std=10)
    .hvplot(
        line_dash=["solid", "dashed", "dotdash"],
        responsive=True,
        height=400,
        title="Seattle Data",
    )
)

plot2 = (
    seattle_bikes2.resample("D")
    .sum()
    .rolling(50, center=True, win_type="gaussian")
    .sum(std=10)
    .hvplot(
        line_dash=["solid", "dashed", "dotdash"],
        responsive=True,
        height=400,
        title="Seattle Data",
    )
)

pipeline = plot1 * plot2

pn.template.FastListTemplate(
    main=[pn.panel(pipeline, sizing_mode="stretch_width")],
).servable()

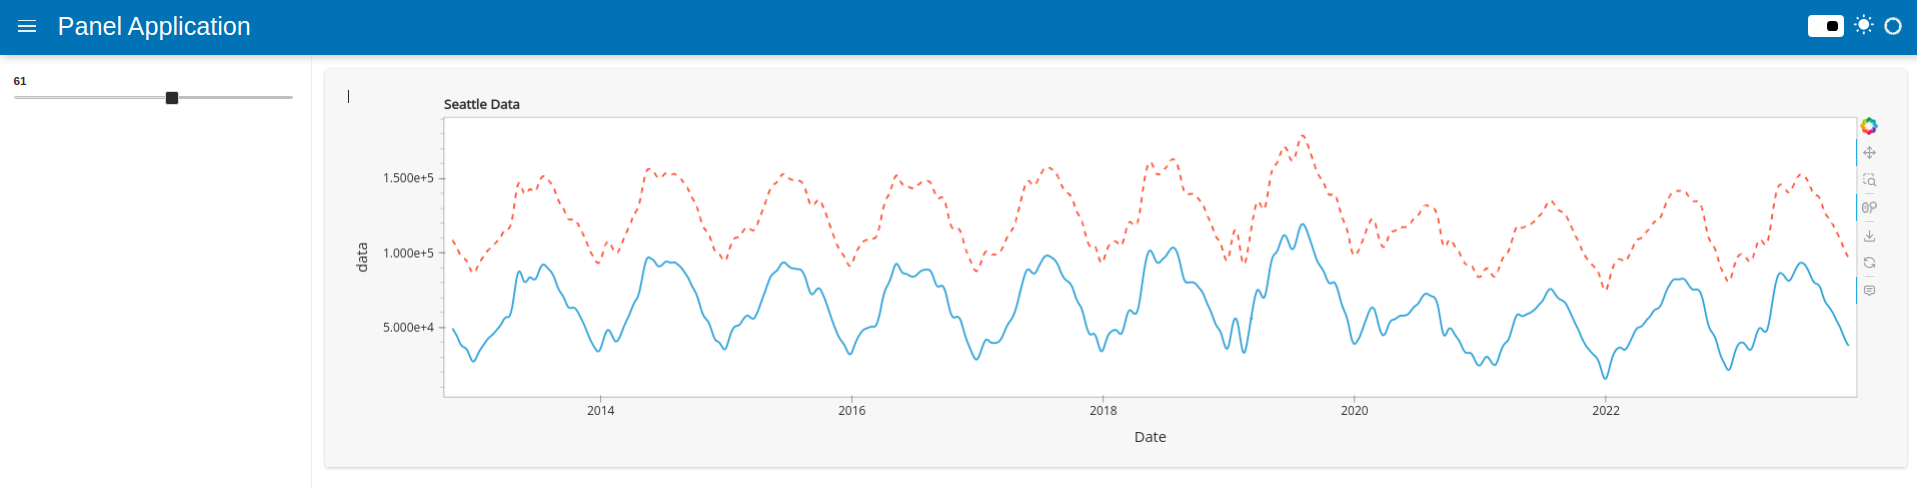
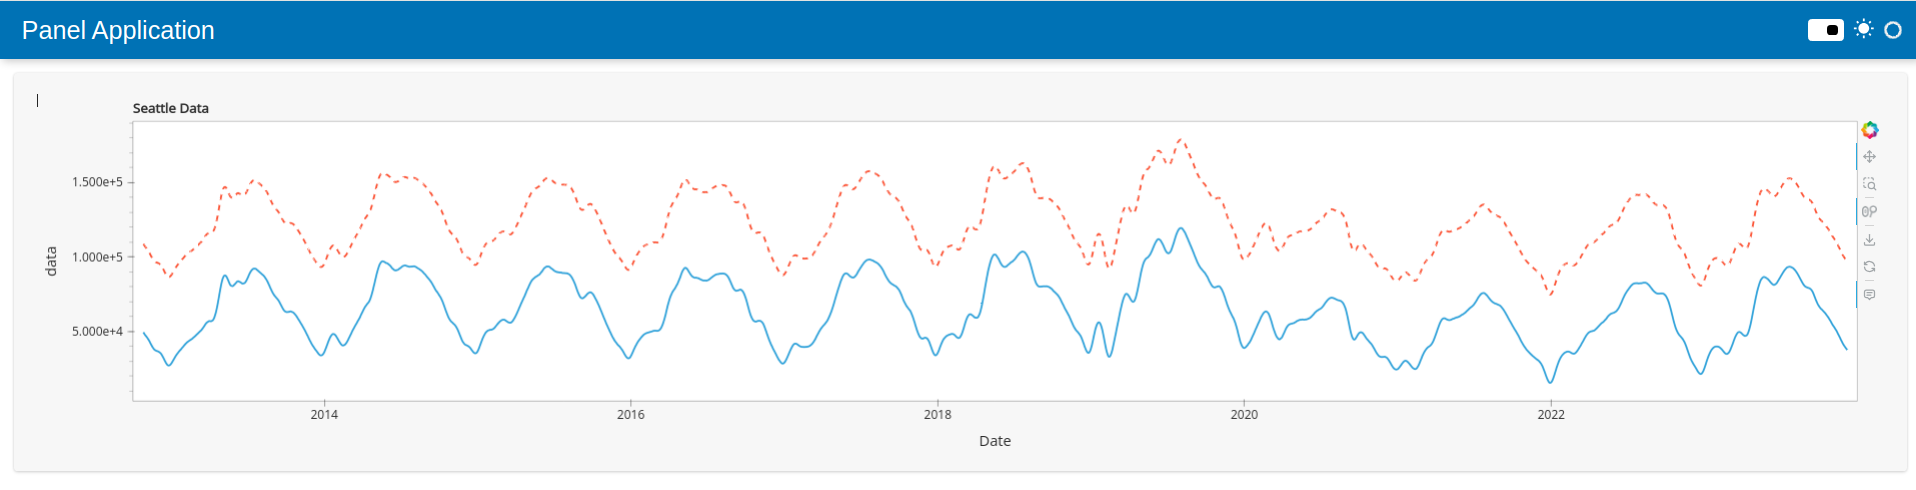
This produces two curves in the same figure

An interactive example

In the interactive case we got twice curve 1, and the curve 2 is not show at all. Code:

import pandas as pd
import hvplot.pandas
import panel as pn

pn.extension(sizing_mode="stretch_width")


def get_data():
    url = "https://data.seattle.gov/api/views/65db-xm6k/rows.csv?accessType=DOWNLOAD"
    file = "rows.csv"
    try:
        seattle_bikes = pd.read_csv(file, parse_dates=["Date"]).set_index("Date")
    except Exception:
        seattle_bikes = pd.read_csv(url, parse_dates=["Date"]).set_index("Date")
        seattle_bikes.to_csv(file)

    bikes = seattle_bikes["Fremont Bridge Sidewalks, south of N 34th St"]
    bikes.name = "data"
    return bikes.to_frame()


rolling = pn.widgets.IntSlider(value=50, start=10, end=100)

seattle_bikes = get_data()


plot1 = (
    seattle_bikes.interactive()
    .resample("D")
    .sum()
    .rolling(rolling, center=True, win_type="gaussian")
    .sum(std=10)
    .hvplot(
        line_dash=["solid", "dashed", "dotdash"],
        responsive=True,
        height=400,
        title="Seattle Data",
    )
)

seattle_bikes2 = seattle_bikes.copy()
seattle_bikes2["data"] += 1e4

plot2 = (
    seattle_bikes2.interactive()
    .resample("D")
    .sum()
    .rolling(rolling, center=True, win_type="gaussian")
    .sum(std=10)
    .hvplot(
        line_dash=["solid", "dashed", "dotdash"],
        responsive=True,
        height=400,
        title="Seattle Data",
    )
)
pipeline = plot1 * plot2

pn.template.FastListTemplate(
    sidebar=[pipeline.widgets()],
    main=[pn.panel(pipeline.holoviews(), sizing_mode="stretch_width")],
).servable()

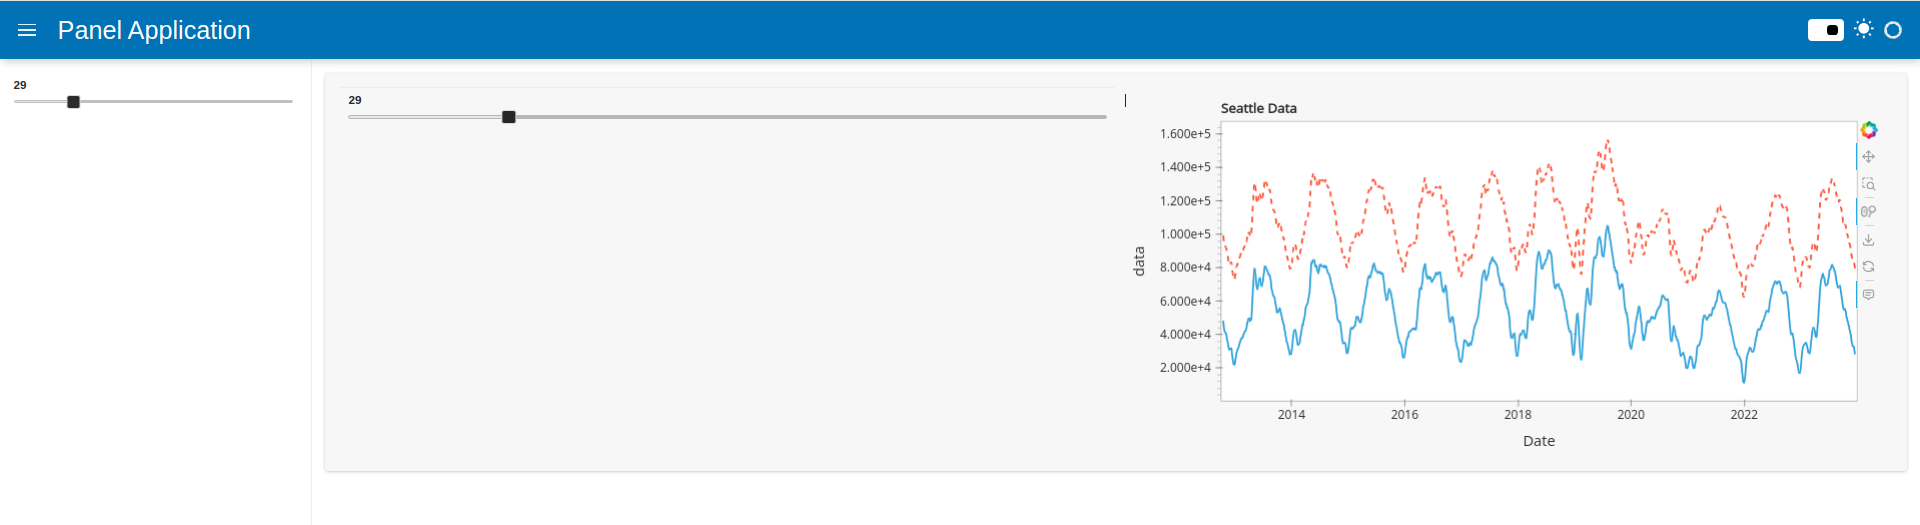
which produces twice curve from plot1, and the curve from plot2 is not show at all.
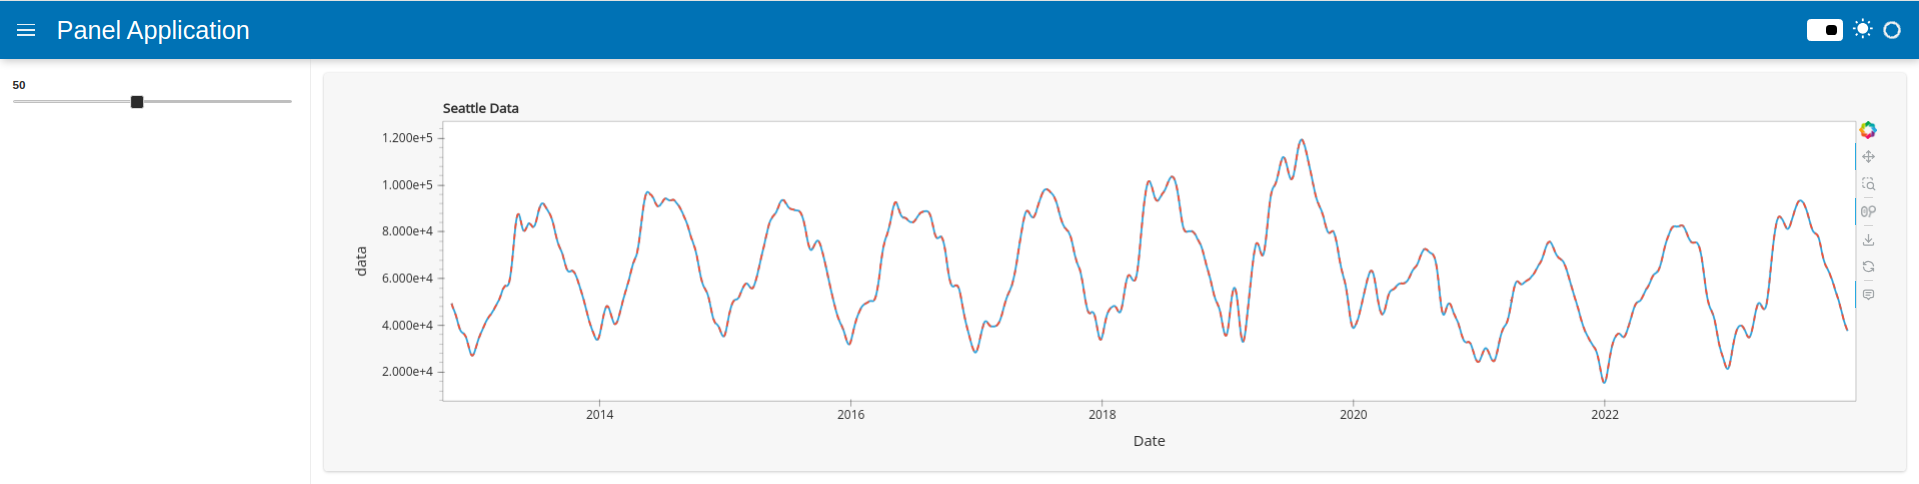
Question(s)

Why the curve from the plot2 is not shown when changing the app interactive (adding widget to control the smoothness?) Is this because I have two different pandas Series and not a single data source…? Or should I somehow name the data sources?

I have the following versions, on python 3.10 on Ubuntu 22.04:

holoviews           1.18.1
hvplot              0.9.1
panel               1.3.6
bokeh               3.3.3
param               2.0.1

Definetly look like a bug. An alternative could be to use pn.rx:

import pandas as pd
import hvplot.pandas
import panel as pn

pn.extension(sizing_mode="stretch_width")


def get_data():
    url = "https://data.seattle.gov/api/views/65db-xm6k/rows.csv?accessType=DOWNLOAD"
    file = "rows.csv"
    try:
        seattle_bikes = pd.read_csv(file, parse_dates=["Date"]).set_index("Date")
    except Exception:
        seattle_bikes = pd.read_csv(url, parse_dates=["Date"]).set_index("Date")
        seattle_bikes.to_csv(file)

    bikes = seattle_bikes["Fremont Bridge Sidewalks, south of N 34th St"]
    bikes.name = "data"
    return bikes.to_frame()


rolling = pn.widgets.IntSlider(value=50, start=10, end=100)

seattle_bikes = get_data()


plot1 = (
    pn.rx(seattle_bikes)
    .resample("D")
    .sum()
    .rolling(rolling, center=True, win_type="gaussian")
    .sum(std=10)
    .hvplot(
        line_dash=["solid", "dashed", "dotdash"],
        responsive=True,
        height=400,
        title="Seattle Data",
    )
)

seattle_bikes2 = seattle_bikes.copy()
seattle_bikes2["data"] *= -1

plot2 = (
    pn.rx(seattle_bikes2)
    .resample("D")
    .sum()
    .rolling(rolling, center=True, win_type="gaussian")
    .sum(std=10)
    .hvplot(
        line_dash=["solid", "dashed", "dotdash"],
        responsive=True,
        height=400,
        title="Seattle Data",
    )
)
(plot1 * plot2)  # to only get the plot use .rx.value
1 Like

Thanks a ton! I was scratching my head off yesterday with this :smiley:

I got it almost working. Here is full code using .rx.value:

import pandas as pd
import hvplot.pandas
import panel as pn

pn.extension(sizing_mode="stretch_width")


def get_data():
    url = "https://data.seattle.gov/api/views/65db-xm6k/rows.csv?accessType=DOWNLOAD"
    file = "rows.csv"
    try:
        seattle_bikes = pd.read_csv(file, parse_dates=["Date"]).set_index("Date")
    except Exception:
        seattle_bikes = pd.read_csv(url, parse_dates=["Date"]).set_index("Date")
        seattle_bikes.to_csv(file)

    bikes = seattle_bikes["Fremont Bridge Sidewalks, south of N 34th St"]
    bikes.name = "data"
    return bikes.to_frame()


rolling = pn.widgets.IntSlider(value=50, start=10, end=100)

seattle_bikes = get_data()

plot1 = (
    pn.rx(seattle_bikes)
    .resample("D")
    .sum()
    .rolling(rolling, center=True, win_type="gaussian")
    .sum(std=10)
    .hvplot(
        line_dash=["solid", "dashed", "dotdash"],
        responsive=True,
        height=400,
        title="Seattle Data",
    )
)

seattle_bikes2 = seattle_bikes.copy()
seattle_bikes2["data"] += 1e2

plot2 = (
    pn.rx(seattle_bikes2)
    .resample("D")
    .sum()
    .rolling(rolling, center=True, win_type="gaussian")
    .sum(std=10)
    .hvplot(
        line_dash=["solid", "dashed", "dotdash"],
        responsive=True,
        height=400,
        title="Seattle Data",
    )
)
combined_plot = plot1 * plot2

pn.template.FastListTemplate(
    sidebar=[rolling],
    main=[pn.panel(combined_plot.rx.value, sizing_mode="stretch_width")],
).servable()

This shows

but it’s not interactive (not responding to the widget). If I remove the .rx.value, i.e.


pn.template.FastListTemplate(
    sidebar=[rolling],
    main=[pn.panel(combined_plot, sizing_mode="stretch_width")], # this changed
).servable()

Then I’ll get this:

it is interactive, responds to both widgets (the widgets are actually in sync), but the layout is not what I would like. What changes would be needed to get the app look exactly like in the first screenshot, but having the interactivity?

This should update the plot as expected pn.ReactiveExpr(plot1 * plot2, show_widgets=False)

1 Like

That does the trick! Thank you for helping! If you think that the original behaviour with .interactive() was a bug, should I file a bug report, and if so, which repo?

I agree this is a bug. It is likely from Hvplot. But I don’t think it will have high priority as interactive will, at some point in the future, change to use .rx behind the scenes and not the current custom implementation that is used now.

1 Like

Ah okay. I see. I will not open a ticket, then. Thanks a lot for the help!

You are always welcome to open a ticket! I just wanted to set the expectation of the priority it would have for the maintainers. That doesn’t mean that it will not be fixed before the shift to param.rx.

1 Like

Yes please open a ticket if you find the time to do so :slight_smile:

Created: When using two pandas.DataFrame.interactive() to create a single plot, one one of the is visible (and duplicated) · Issue #1254 · holoviz/hvplot · GitHub

1 Like