Hello,
How can I port the plot parameters from bokeh holoviews Image to a matplotlib gif. I know pretty sure that it needs to be possible, because I did it yesterday (s. screenshot from gif:
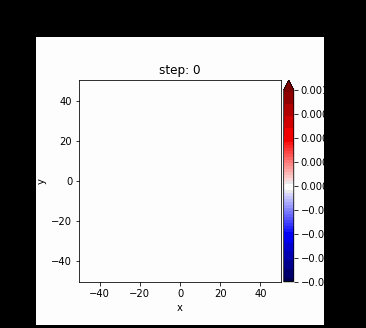
the plot params, such as the colorbar were created with bokeh)
, but somehow I can’t reproduce it anymore, although the code is the same.
The relevant code:
rand, x, y, z, step = np.random.randn(2, 10, 10, 10), np.linspace(0, 10, 10), np.linspace(0, 10, 10), np.linspace(0, 10, 10), [0, 1]
xa2 = xr.DataArray(rand, coords=dict(step=step, x=x, y=y, z=z, )
             , dims=["step", "x", "y", "z"], name="field2")
hv_dst = hv.Dataset(xa2)
hv_imt = hv_dst.to(hv.Image)
fig = hv.render(hv_imt.opts(colorbar=True, width=500, height=400, cmap='seismic', clim=(-10**-3, 10**-3)), backend='matplotlib')
test2 = fig.save("testissue.gif", fps=0.5, dpi=200,)
I would have expected that testissue.gif contained a colorbar and so on, but it doesn’t…
I also tried with dynamic=True, but didn’t help.
Thanks in advance!