ea42gh
February 14, 2024, 3:07pm
1
I use the following function a lot:
def stem_plot(data, curve=False, baseline=True, basevalue=None, marker=True, kdims=["x","y"], **args):
    if basevalue is None:  basevalue = 0
    data = np.array(data).reshape(len(data))
    x = list( range(1,len(data)+1))
    y = np.full( len(data), basevalue)
    e = data
    vlines = [ np.array( [[x[i], y[i]], [x[i], e[i]]]) for i in range(len(x)) ]


    hs = hv.Path( vlines, kdims, **args ).opts( show_legend=True, muted_alpha=0.)
    if baseline: hs = hs * hv.HLine(basevalue).opts(line_width=0.4)
    if marker:   hs = hs * hv.Scatter((x,e), *kdims, **args).opts(size=4, muted_alpha=0.)
    if curve:    hs = hs * hv.Curve((x,e), *kdims, **args).opts(line_width=0.8, muted_alpha=0.)

    return hs
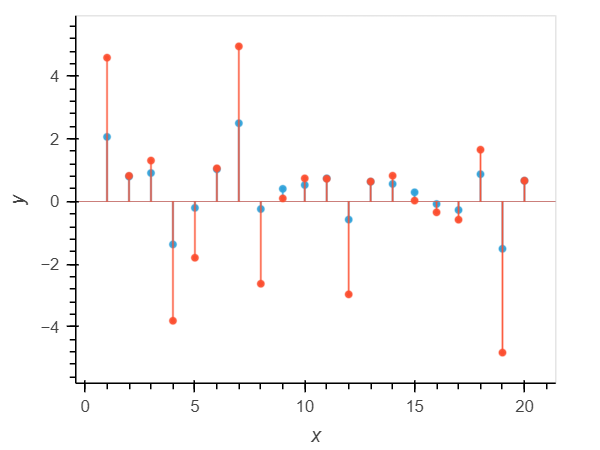
e.g.,
noisy = [ 2.06  0.8   0.91 -1.37 -0.2   1.03  2.5  -0.24  0.4   0.53  0.74 -0.58
  0.63  0.56  0.29 -0.08 -0.27  0.87 -1.51  0.66]
filtered = [ 4.59  0.82  1.31 -3.81 -1.8   1.06  4.95 -2.63  0.1   0.74  0.73 -2.96
  0.64  0.82  0.03 -0.35 -0.58  1.65 -4.82  0.66]
pn.Row(stem_plot( noisy ).opts("Path", width=400)* stem_plot( filtered ))
One of the annoyances is that applying opts() to the resulting output requireshv.Path.
I am looking for suggestions on how best to implement this type of plot!
I think you might be looking for hv.Spikes?
ea42gh
February 14, 2024, 3:13pm
3
@huang11 , you could indeed implement stem_plot() using hv.Spikes.hv.Path instead. The question I am trying to ask is how best to implementhv.Elements with its own options, etc.
The function I currently use does what I want, but could use any number of improvements!
Here’s how a ViolinPlot is created inside HoloViews
          class ViolinPlot(BoxWhiskerPlot):

              bandwidth = param.Number(default=None, doc="""
                  Allows supplying explicit bandwidth value rather than relying
                  on scott or silverman method.""")

              clip = param.NumericTuple(default=None, length=2, doc="""
                  A tuple of a lower and upper bound to clip the violin at.""")

              cut = param.Number(default=5, doc="""
                  Draw the estimate to cut * bw from the extreme data points.""")

              inner = param.ObjectSelector(objects=['box', 'quartiles', 'stick', None],
                                           default='box', doc="""
                  Inner visual indicator for distribution values:

                    * box - A small box plot
                    * stick - Lines indicating each sample value
                    * quartiles - Indicates first, second and third quartiles
                  """)
show original
Maybe you can add an implementation somewhere here holoviews/holoviews/plotting/bokeh/chart.py at main · holoviz/holoviews · GitHub
ea42gh
February 14, 2024, 3:32pm
5
I would think of it as a kind of hv.Curve with a no interpolation option
1 Like