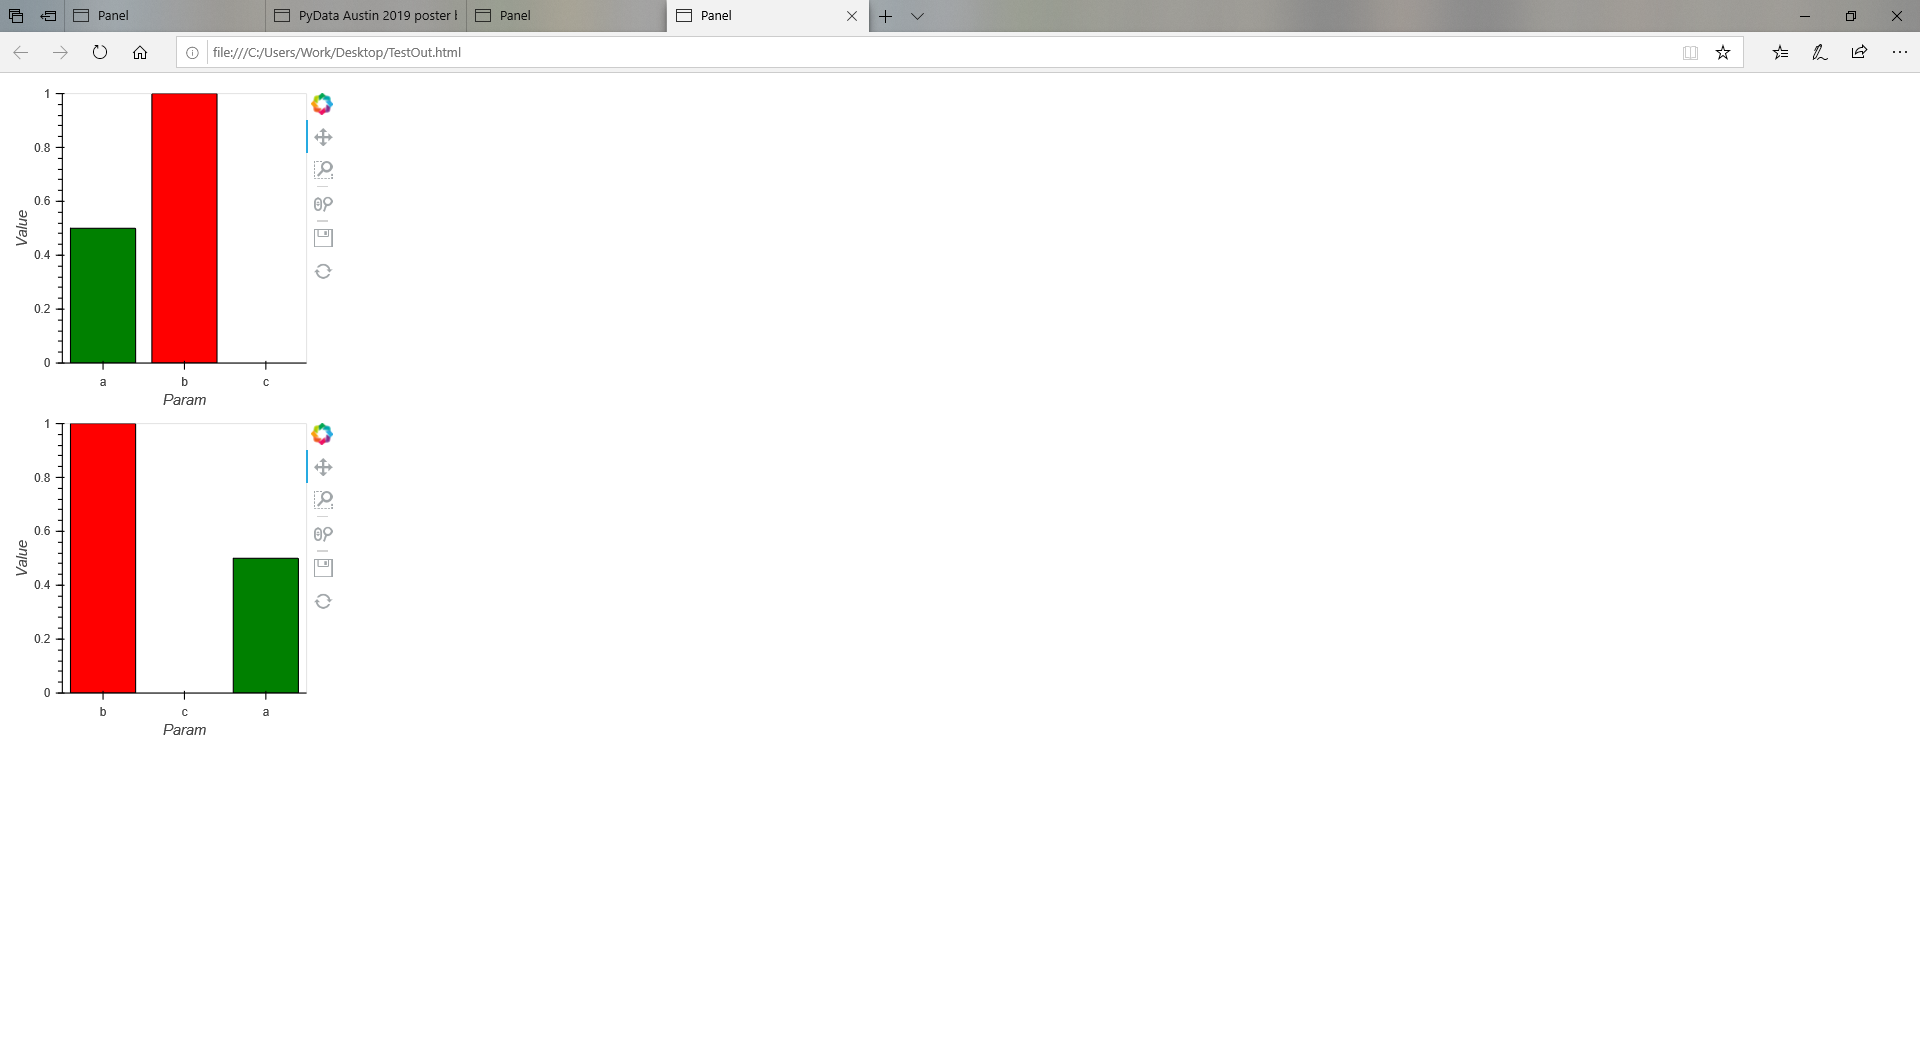
When using panel to compose two Holoviews plots showing the same data in different order. How does one show the same plot with different ordering of an axis together?
In other words. If we have bars corresponding to categories: ‘a’,b’,‘c’ and I wish to show them next to each other once in the order of ‘a’,‘b’,‘c’, and once as displayed as ‘b’,‘c’,a’ , how to do it?
The solution may seem trivial. However, rearranging the axis and putting the holoviews objects next to each other in panel does not work - see below:
import panel
import holoviews
from holoviews import opts
from bokeh.resources import INLINE


holoviews.extension('bokeh')
data = {
    'Param': ['b','c', 'a'],
    'Value': [1, 0, 0.5],
    'alpha': [0.5, 1, 0.3],
    'color': ['red', 'blue', 'green'],
    'marker': ['circle', 'triangle', 'diamond'],
    'size': [15, 25, 40]
}

opts.defaults(opts.Points(padding=0.1, size=8, line_color='black'))

Plot1 = holoviews.Bars(data, kdims=['Param'], vdims=['Value', 'color']).redim.values(Param=['a','b','c']).opts( color='color')
Plot2 = holoviews.Bars(data, kdims=['Param'], vdims=['Value', 'color']).opts( color='color')

Out1=panel.panel(Plot1)
Out2=panel.panel(Plot2)

Out = panel.Column(Out1,Out2)
Out.save('TestOut', resources=INLINE)
The output is:
How to fix this problem?