I am trying to simply query the x_range of a holoviews plot. The issue I have is that unless the x_range limits are linked to a widget, the query always returns the range of the data, not the axis ranges.
I have tried querying the range using get_root() on the panel to return the bokeh doc, as well as using the holoviews renderer.get_plot() method and querying the handles dict.
The minimal example code simply creates 2 independent hv.Curve plots, and upon clicking the button, the x_range of the two plots is queried using the two methods defined above. The only case in which the correct current x_range is returned is when the plot x_range (the plot on the left) has a jslink with a panel widget. Otherwise the data range is always returned.
Minimal example
# Example illustrating the output when the x_range of a hv.Curve plot is queried on a button click event

import holoviews as hv
import numpy as np
import pandas as pd
import panel as pn

hv.extension('bokeh')
renderer = hv.renderer('bokeh')

x_range_fmt = "({:.3f}, {:.3f})"

# Create dummy dataset
num_pts = 1000
df = pd.DataFrame({'x': np.linspace(0, 100, num_pts), 'y': np.cumsum(np.random.randn(num_pts))})

# Create scatterplots
hv_plots = [hv.Curve(df, 'x', 'y').opts(axiswise=True) for i in range(2)]

txt_xrange_doc = [pn.widgets.StaticText(name="x_range using get_root", value='x_range: (,)') for i in range(2)]
txt_xrange_renderer = [pn.widgets.StaticText(name="x_range using get_plot", value='x_range: (,)') for i in range(2)]


def query_x_range(event):
    for i in range(2):
        # Query x_range by using get_root on panel to obtain bokeh document
        xrng_doc = panel.get_root().children[i].children[0].x_range
        xrng_str = x_range_fmt.format(xrng_doc.start, xrng_doc.end)
        txt_xrange_doc[i].value = xrng_str

        # Query x_range by using holoviews renderer to get plot handles
        xrng_renderer = renderer.get_plot(panel[i][0].object).handles['x_range']
        xrng_str = x_range_fmt.format(xrng_renderer.start, xrng_renderer.end)
        txt_xrange_renderer[i].value = xrng_str


update_button = pn.widgets.Button(name='Query figure x_range', button_type='primary')
update_button.on_click(query_x_range)

f1 = pn.widgets.FloatSlider(name="Range", start=-100, end=200, value=0.0)
f2 = pn.widgets.FloatSlider(name="Range", start=-100, end=200, value=0.0)
f1.jslink(hv_plots[0], **{'value': 'x_range.start'}, bidirectional=True)
f2.jslink(hv_plots[0], **{'value': 'x_range.end'}, bidirectional=True)

# Create panel
panel = pn.Row(pn.Column(hv_plots[0], txt_xrange_doc[0], txt_xrange_renderer[0], f1, f2),
               pn.Column(hv_plots[1], txt_xrange_doc[1], txt_xrange_renderer[1], update_button))
panel.show()
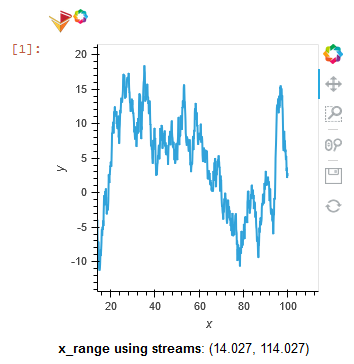
Example code visualization