Hi @mmorys,
How about using streams? More specifically RangeX.
You can find more info about streams via the links below:
http://holoviews.org/user_guide/Custom_Interactivity.html
http://holoviews.org/user_guide/Responding_to_Events.html
Here is a toy example that you may try to see if it fits with your needs:
import numpy as np
import pandas as pd
import holoviews as hv
import panel as pn

hv.extension('bokeh')
pn.extension()

num_pts = 1000
df = pd.DataFrame({'x': np.linspace(0, 100, num_pts), 'y': np.cumsum(np.random.randn(num_pts))})
hv_plot = hv.Curve(df, 'x', 'y')

rng = hv.streams.RangeX(source=hv_plot)

@pn.depends(rng.param.x_range)
def display_xrange(xr):
    value = f"({xr[0]:.3f}, {xr[1]:.3f})" if xr else None
    return pn.widgets.StaticText(name="x_range using streams", value=value, width=400)

app = pn.Column(hv_plot, display_xrange)
app
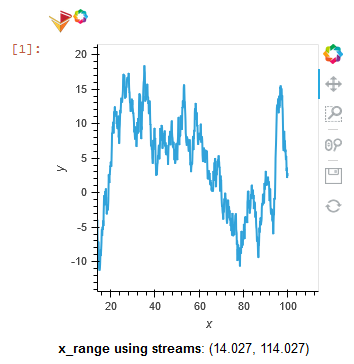
It’s likely the layout isn’t exactly what your after, I hope it’ll help you anyway 