When I use holoviews.streams.Buffer and hv.DynamicMap(gv.Points, streams=[dfstream]) to stream point geometries onto a geoviews.tile_source it works just fine. However what I really want to do is datashade the points before plotting on the map but this seems to have a strange effect on the plot projection.
Edit to add this version info:
Geoviews: 1.8.1
Holoviews: 1.13.3
Here is an example of streaming the point geometries.
import param, geoviews as gv, holoviews as hv
import pandas as pd, numpy as np
from datashader.utils import lnglat_to_meters as webm
from holoviews.operation.datashader import datashade

gv.extension('bokeh',logo=False)

class Mapview(param.Parameterized):
    tiles         = gv.tile_sources.CartoEco()
    template_df   = pd.DataFrame({'lng': [], 'lat': []}, columns=['lng', 'lat'])
    dfstream      = hv.streams.Buffer(template_df, index=False, length=100000, following=False)
    points        = hv.DynamicMap(gv.Points, streams=[dfstream])
    map_layout    = tiles * points
   #map_layout = tiles * datashade(points)

    def show_map(self):
        self.map_layout.opts(
            gv.opts.WMTS(global_extent=True,width=800,height=400,show_grid=False,xaxis=None,yaxis=None),
            gv.opts.Points(size=5, color='green', fill_alpha=0.3, line_alpha=0.4)
        )
        return self.map_layout.opts(data_aspect=0.5)

m = Mapview()
m.show_map()
And then I can stream data onto it like so:
lng = np.random.uniform(-120.24150,-70.796140, 10000)
lat = np.random.uniform(14.6256105,60.7169661, 10000)
df = pd.DataFrame(list(zip(lng,lat)),columns=['lng','lat'])
m.dfstream.send(df[['lng','lat']])
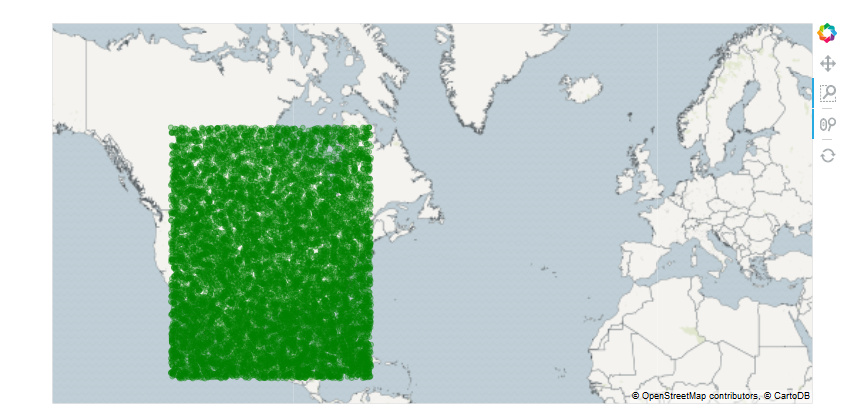
And it works just fine; it looks like this.
If you switch the commented
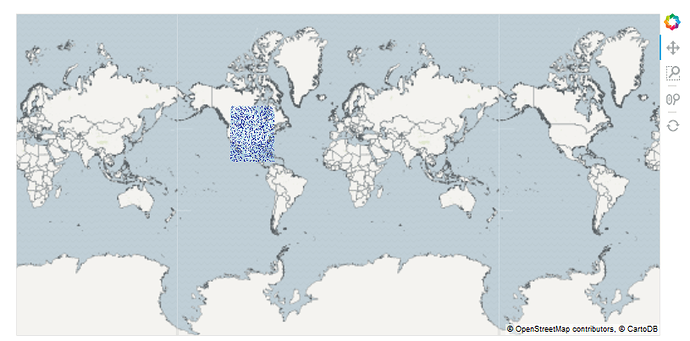
map_layout declaration in the Mapview() class to get a datashaded image on the map and run it again things go a bit strange. On first glance it appears to have worked:
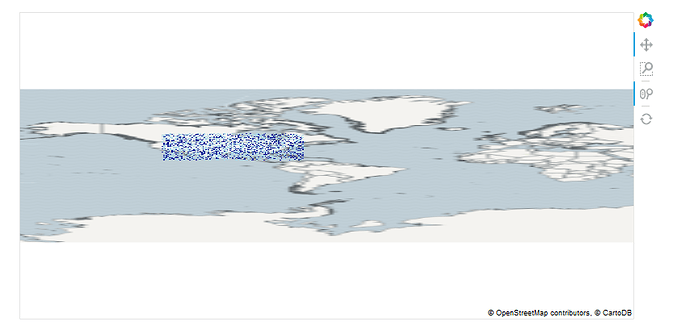
However, using the zoom tools on the plot results in strange skewing which does not happen with the non-datashaded points.
I tried converting the x,y values to meters before streaming to the map
df.loc[:,'x_meters'], df.loc[:,'y_meters'] = webm(df.lng, df.lat)
…and changing the template_df columns in Mapview() appropriately but then nothing at all appears on the map.
How do I prevent the map from skewing in this scenario?


