@Marc Hmmm, unfortunately I’m not sure what’s going on there. It seems that there’s a problem with the field you set as the ID field – I’ll deal with that separately, thanks for pointing it out. When I set the fields like so it seems to work. What happens when you try this?
Input File: ebird_10000.csv
X Field: lng
Y Field: lat
ID field: comName
And then draw boxes. For the BoxEdit tool you can hold shift + drag your mouse on the map to draw a box, or you can double click as per https://holoviews.org/reference/streams/bokeh/BoxEdit.html
I’ve been drawing boxes on the coastlines of the Yucatan in Eastern Mexico, and on the coastlines of the Baja peninsula in the West. It seems to work well.

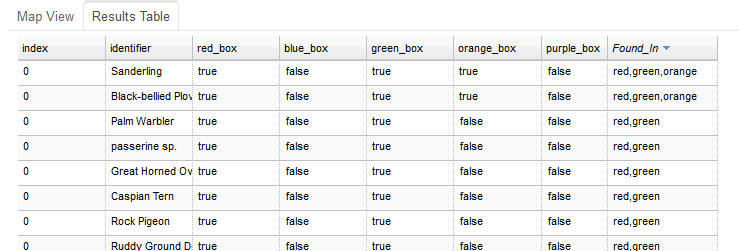
This is unrelated to my extents problem, but since you seem to like the idea of this dashboard (thank you, by the way  ) if you switch tabs above the map after you get results you will see a summary table which describes which birds were found in which boxes; you can sort the columns by clicking them. In this summary table, the values of the ‘identifier’ column come from the field the user selects as the ID field; in the example below I have used
 comName which displays the common name of the birds. The idea is that users can use whichever data they like, query it by drawing boxes, and find out which data values (identifiers) are in which locations.