How to set Geoviews map extent programmatically in Panel dashboard

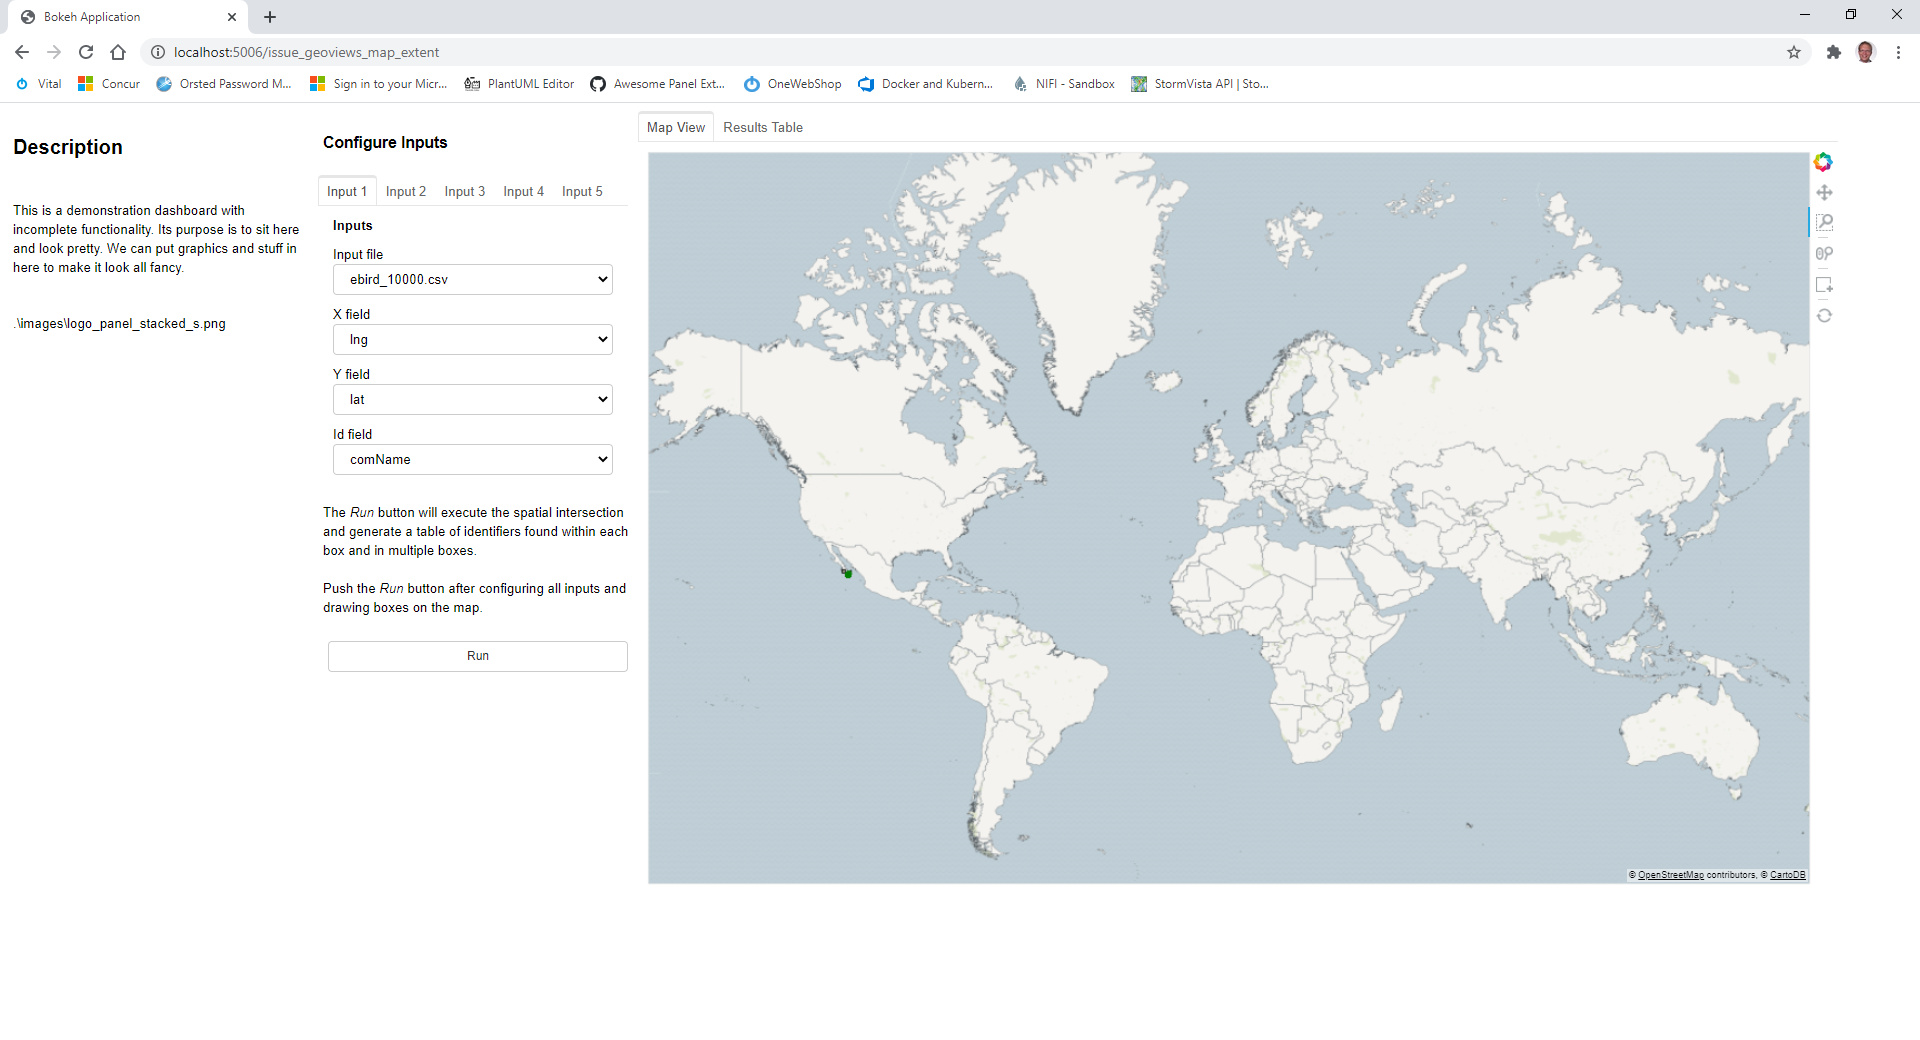
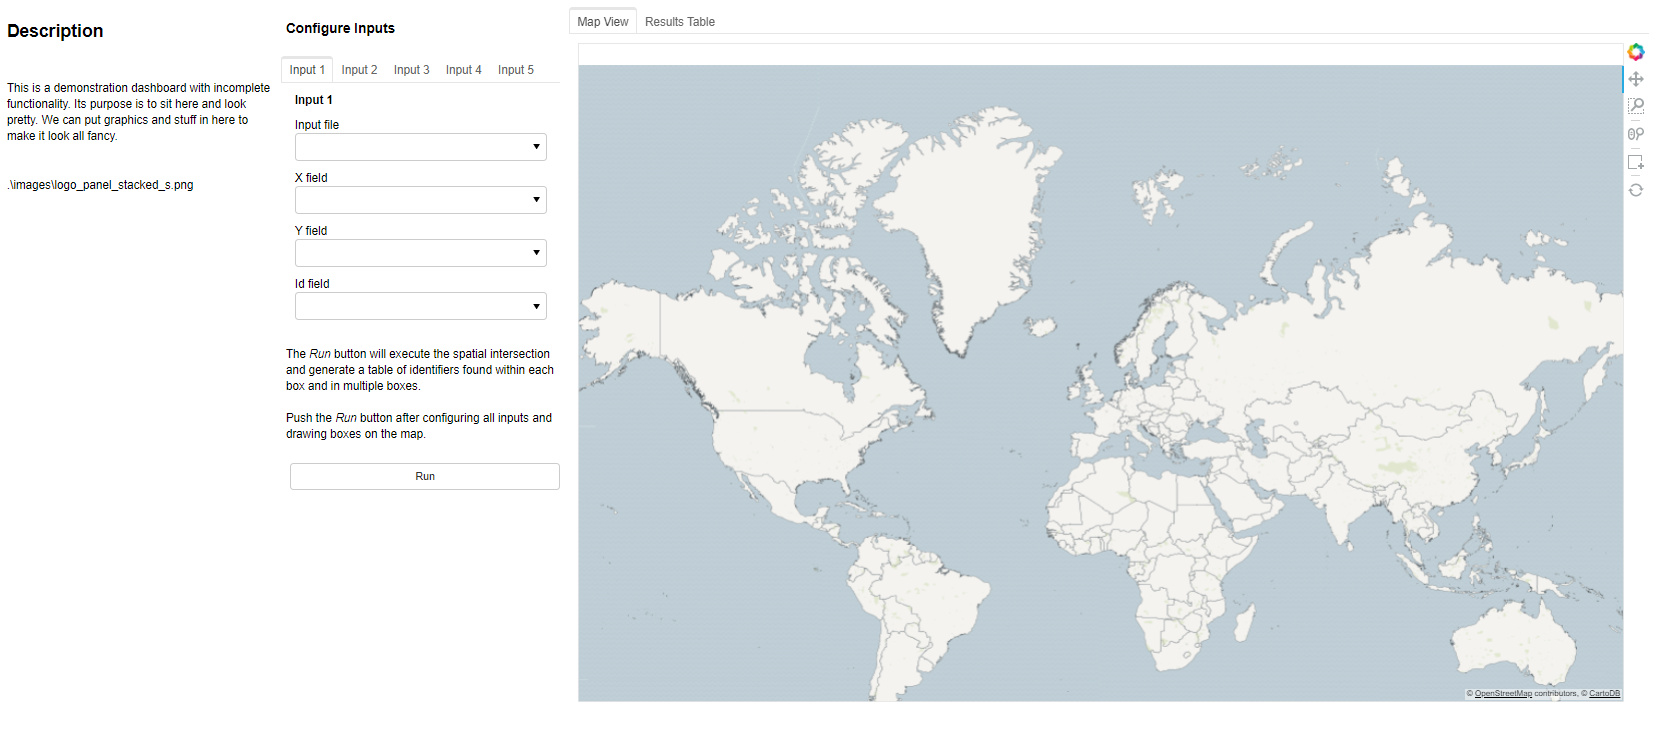
I have a Panel dashboard that looks like this:

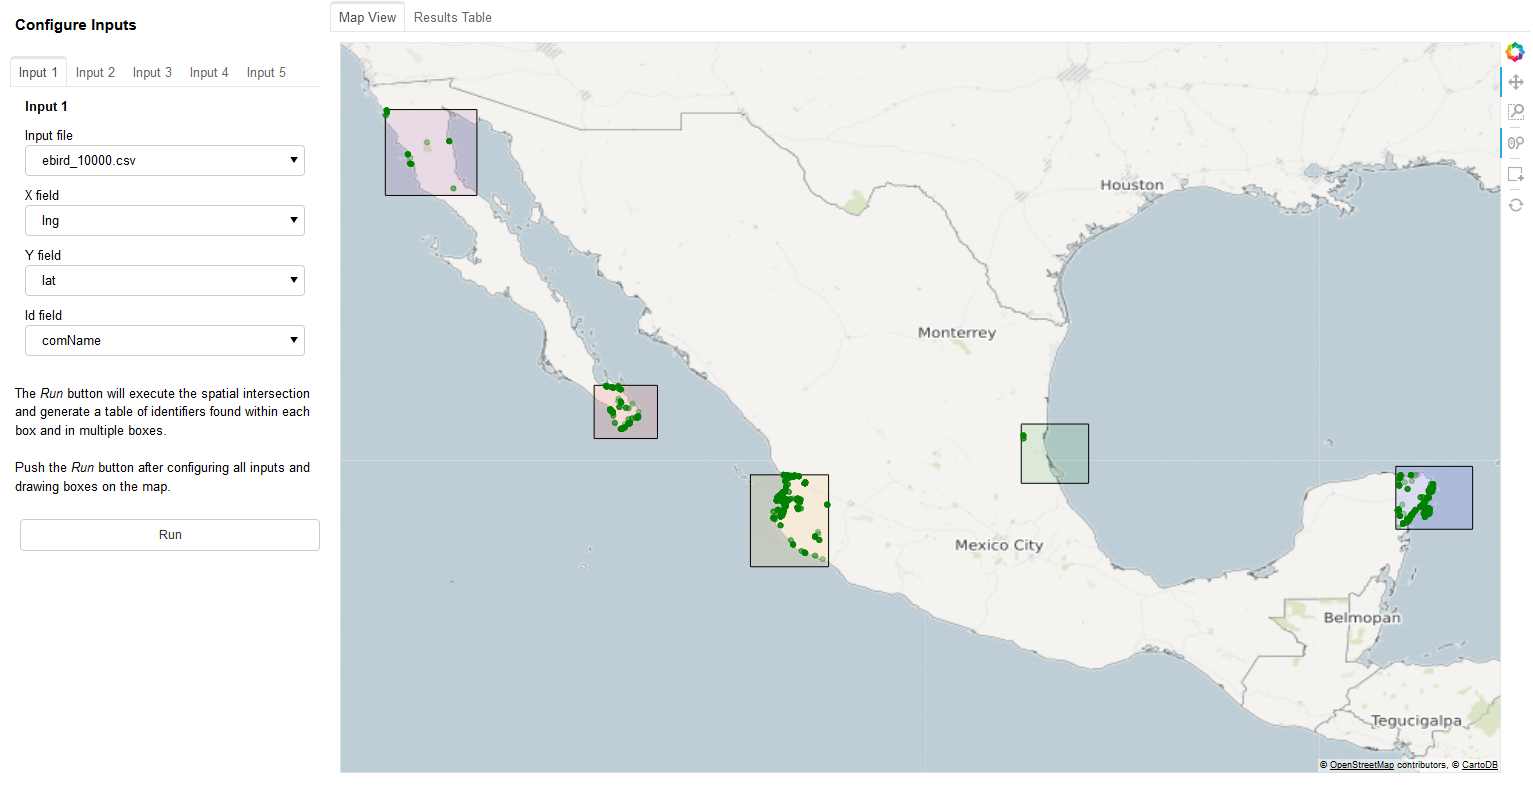
The user selects one or more file inputs, sets some fields via param.Selector() widgets, and draws boxes on the map via hv.streams.BoxEdit. When the user pushes the ‘Run’ button, the input data is queried for points that intersect the drawn boxes and results are streamed back to the map via hv.streams.Buffer and a corresponding hv.DynamicMap(hv.Points, streams=[dfstream]). This all works very well.

The map in my dashboard is controlled by an instance of this class:

class Mapview(param.Parameterized):
    
    opts          = dict(width=1200,height=750,xaxis=None,yaxis=None,show_grid=False)
    tiles         = gv.tile_sources.CartoEco().apply.opts(**opts)
    extents       = param.Parameter(default=(-168, -60, 168, 83), precedence=-1)
    tiles.extents = extents.default
    box_polygons  = gv.Polygons([]).opts(fill_alpha=0.1)
    box_colours   = ['red','blue','green','orange','purple']
    box_stream    = hv.streams.BoxEdit(source=box_polygons, num_objects=5, styles={'fill_color': box_colours})
    template_df   = pd.DataFrame({'x_meters': [], 'y_meters': []}, columns=['x_meters', 'y_meters'])
    dfstream      = hv.streams.Buffer(template_df, index=False, length=10000)
    points        = hv.DynamicMap(hv.Points, streams=[dfstream]).opts(
                                  size=5, color='green', fill_alpha=0.3, line_alpha=0.4)
    
    def show_map(self):
        return self.tiles * self.box_polygons * self.points

Because my dashboard is initialized with empty hv.Points and gv.Polygons objects (there are no points on the map & no boxes have been drawn but the placeholder objects have been created empty), Geoviews auto-zooms the map to these empty datasets and the map appears zoomed in on 0,0. To solve this problem I set the .extents property on my gv.tile_source to zoom to a global extent. The problem is that when the query results are streamed back to the hv.streams.Buffer the map is refreshed and is reset back to the extents I defined above.

I either want the map to stay zoomed where it is (i.e. where the user put it) or I want to be able to control the map zoom programmatically but I haven’t been able to accomplish either. For the latter I tried adding a new class param.Parameter e and modifying my Mapview.show_map() method like this:

Note: I don’t think I should have to set watch=True but without it the function is not triggered when e is set as shown below.

@param.depends('e',watch=True)
def show_map(self):
    print('show_map() has been called.')
    try:
        if self.e[0] is None:
            print('Using global extent')
            return (self.tiles * self.box_polygons * self.points).options(xlim=(-20000000,20000000),ylim=(-6000000,6000000))
        else:
            print(f'Using new extents: {self.e[0]},{self.e[2]},{self.e[1]},{self.e[3]}')
            return (self.tiles * self.box_polygons * self.points).options(xlim=(self.e[0],self.e[2]),ylim=(self.e[1],self.e[3]))            
    except:
        print('Problem in show_map()')

and then setting e like this after the user pushes the run button.

boxes = self.mapview.box_stream.data
xmin = min(boxes['x0'])
xmax = max(boxes['x1'])
ymin = min(boxes['y0'])
ymax = max(boxes['y1'])
new_extent = box(xmin,ymin,xmax,ymax)
self.mapview.e = new_extent.bounds

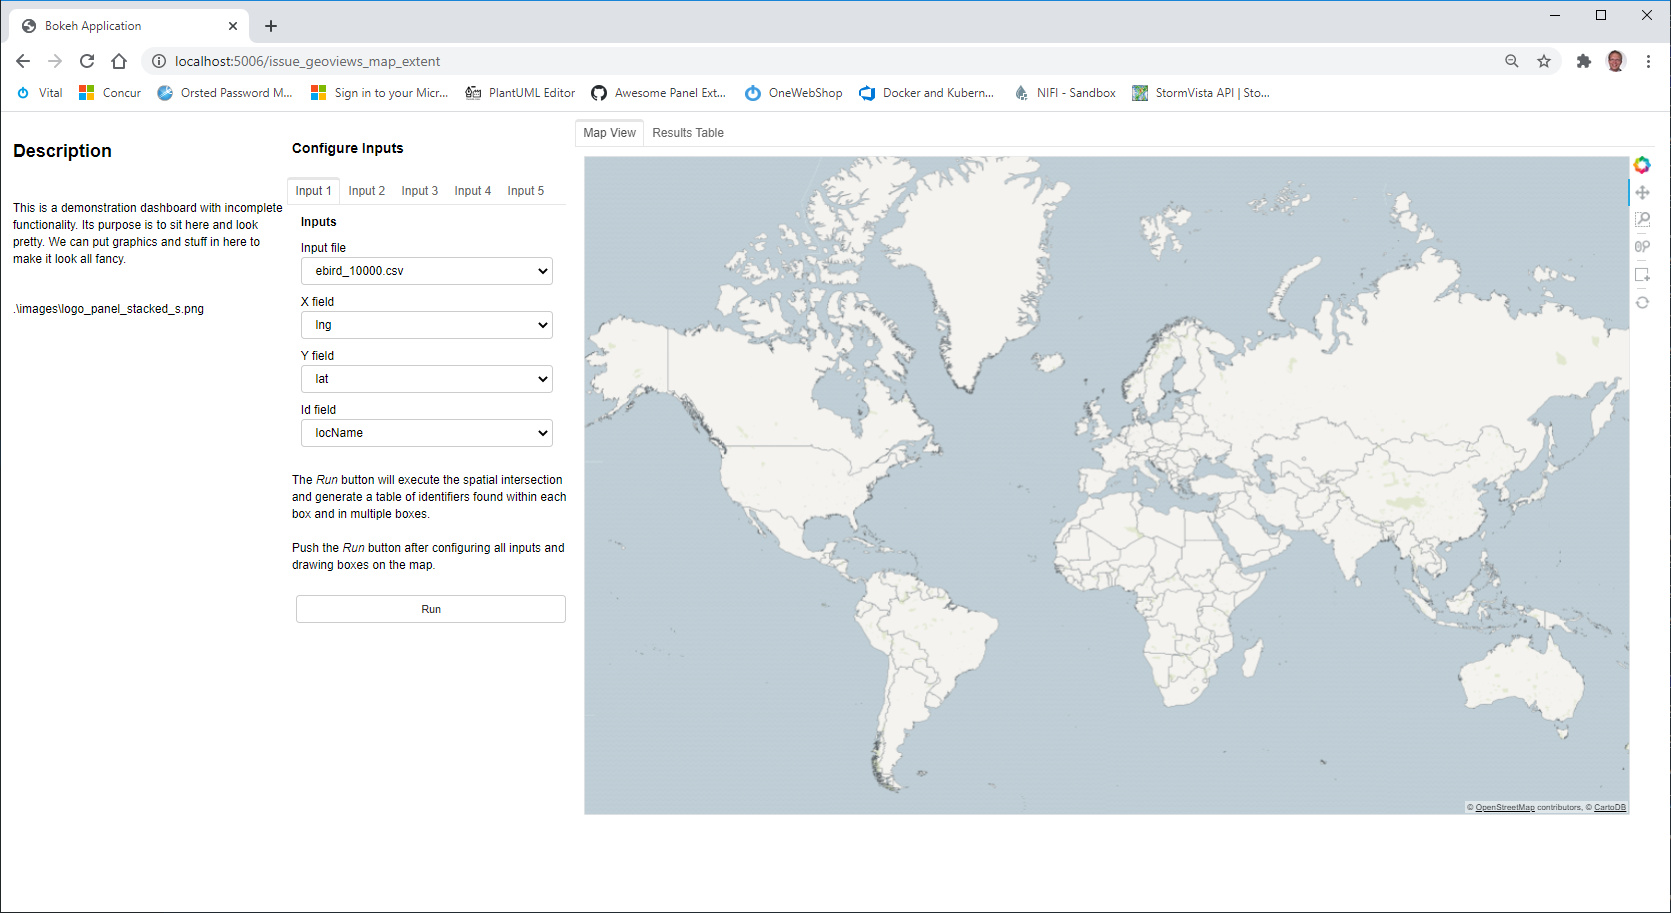
But it doesn’t zoom to the desired extent and also skews (reprojects?) the map to look like this:

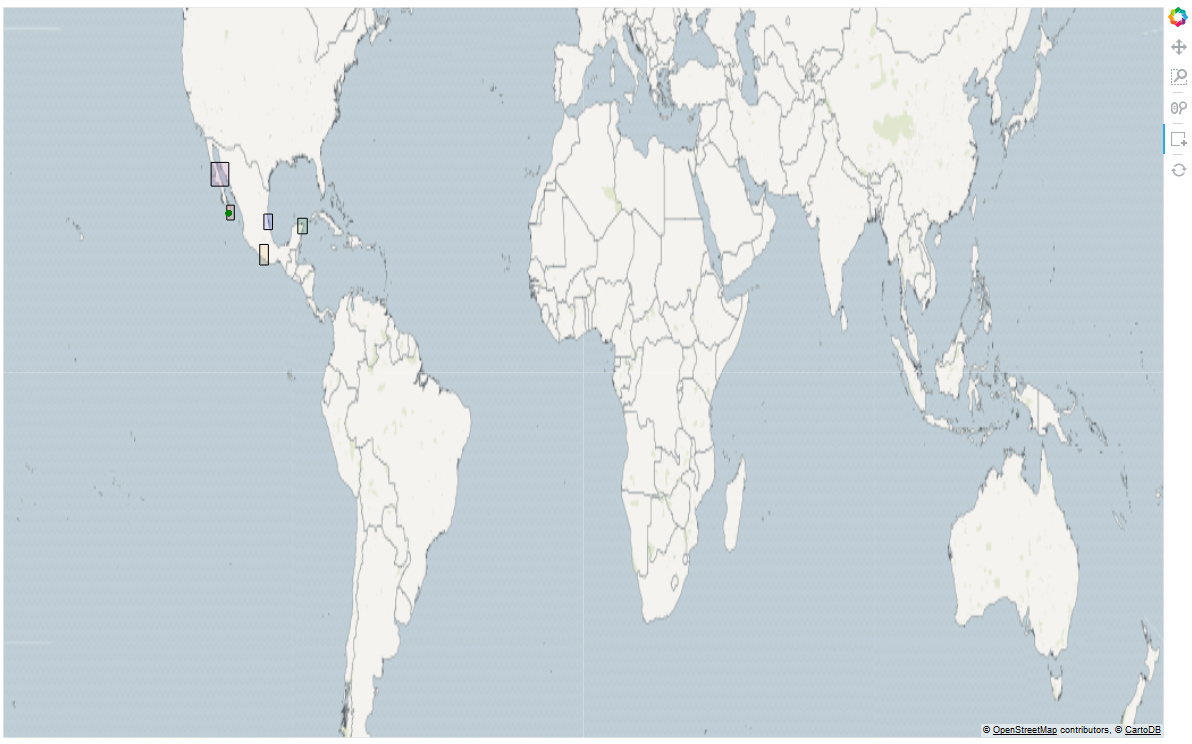
How can I prevent the map from zooming to the initial extent after data is sent to the hv.streams.Buffer? Or, how can I get the map to zoom where I want it to and not skew? I’d be happy to provide the full Jupyter Notebook code but didn’t want to pollute this post by making it even longer.

A fully runnable example (i.e. the notebook) would be hugely appreciated.

@philippjfr Of course, sorry about that. I’ve also provided a sample input file.

I have the following package versions:

GeoViews: 1.8.1
HoloViews: 1.13.3
Panel: 0.9.7
Param: 1.9.3

ebird_10000.csv (1.5 MB)

import panel as pn
import param
import geoviews as gv
import holoviews as hv
import pandas as pd
import geopandas as gpd
from cartopy import crs
from datashader.utils import lnglat_to_meters
from shapely.geometry import Point, box

gv.extension('bokeh',logo=False)
pn.extension()


class Inputs(param.Parameterized):
    
    input_file = param.FileSelector(path='.\sample_data\*.csv', doc='A .csv file selector for input data')
    x_field    = param.Selector(doc='A field selector for longitude')
    y_field    = param.Selector(doc='A field selector for latitude')
    id_field   = param.Selector(doc='A field selector for the identifier')
    data       = None
    
    @param.depends('input_file', watch=True)
    def update_inputs(self):
        
        df                          = pd.read_csv(self.input_file)
        numeric_cols                = list(df.select_dtypes(include=['float64']).columns)
        columns                     = [x for i,x in enumerate(df.columns) if x !='Unnamed: 0']
        self.param.x_field.objects  = numeric_cols
        self.x_field                = numeric_cols[0]
        self.param.y_field.objects  = numeric_cols
        self.x_field                = numeric_cols[0]
        self.param.id_field.objects = columns
        self.id_field               = columns[0]
        self.data                   = df

        
class Mapview(param.Parameterized):
    
    opts          = dict(width=1200,height=750,xaxis=None,yaxis=None,show_grid=False)
    tiles         = gv.tile_sources.CartoEco().apply.opts(**opts)
    extents       = param.Parameter(default=(-168, -60, 168, 83), precedence=-1)
    tiles.extents = extents.default
    box_polygons  = gv.Polygons([]).opts(fill_alpha=0.1)
    box_colours   = ['red','blue','green','orange','purple']
    box_stream    = hv.streams.BoxEdit(source=box_polygons, num_objects=5, styles={'fill_color': box_colours})
    template_df   = pd.DataFrame({'x_meters': [], 'y_meters': []}, columns=['x_meters', 'y_meters'])
    dfstream      = hv.streams.Buffer(template_df, index=False, length=10000)
    points        = hv.DynamicMap(hv.Points, streams=[dfstream]).opts(
                                  size=5, color='green', fill_alpha=0.3, line_alpha=0.4)
    
    def show_map(self):
        return self.tiles * self.box_polygons * self.points

    
class Dashboard(param.Parameterized):
    
    input1    = Inputs()
    input2    = Inputs()
    input3    = Inputs()
    input4    = Inputs()
    input5    = Inputs()
    mapview   = Mapview()
    
    button = param.Action(lambda x: x.param.trigger('button'), label='Run')

    def project_to_meters(self, df, x, y):
        try:
            df.loc[:,'x_meters'], df.loc[:,'y_meters'] = lnglat_to_meters(df[x],df[y])
            geometry = [Point(xy) for xy in zip(df.x_meters, df.y_meters)]
            web_merc = {'init': 'epsg:3857'}
            return gpd.GeoDataFrame(df, crs=web_merc, geometry=geometry)
        except:
            print("""Could not project specified coordinate fields to meters. Make sure the X Field and Y Field 
                  values have been set correctly.\n""")

    
    def convert_box_stream_data_to_geometry(self):
        try:
            box_data = self.mapview.box_stream.data        
            try:
                num_boxes = len(box_data['x0'])
            except:
                num_boxes = 0

            boxes     = []
            for i in range(0,num_boxes):
                x0 = box_data['x0'][i]
                y0 = box_data['y0'][i]
                x1 = box_data['x1'][i]
                y1 = box_data['y1'][i]
                boxes.append(box(x0,y0,x1,y1))
            if len(boxes)>0:
                return boxes
        except:
            print('Could not convert boxes drawn on map into geometries.\n')


    @param.depends('button')
    def run_analysis(self):
        try:
            # clear previous results
            self.mapview.dfstream.clear()

            # Convert each input into a GeoDataFrame and project coordinates to meters
            datasets  = []
            id_fields = []
            for i in [self.input1, self.input2, self.input3, self.input4, self.input5]:
                if isinstance(i.data, pd.core.frame.DataFrame):
                    gdf = self.project_to_meters(i.data, i.x_field, i.y_field)
                    datasets.append(gdf)
                    id_fields.append(i.id_field)

            # Convert boxes drawn on the map into Shapely geometries
            if len(datasets)>0:
                boxes     = []
                box_data = self.mapview.box_stream.data
                for i in range(0,len(box_data['x0'])):
                    x0 = box_data['x0'][i]
                    y0 = box_data['y0'][i]
                    x1 = box_data['x1'][i]
                    y1 = box_data['y1'][i]
                    boxes.append(box(x0,y0,x1,y1))

                # Do intersections of each box on each GeoDataFrame & send results to the map
                df_all_boxes = pd.DataFrame()
                df_final = pd.DataFrame()
                box_labels = []
                for i in range(0,len(datasets)):
                    for b in boxes:
                        box_label = self.mapview.box_colours[boxes.index(b)] + '_box'
                        box_labels.append(box_label)
                        datasets[i][box_label] = datasets[i].intersects(b)
                        selected = datasets[i].loc[datasets[i][box_label]==True].drop(columns='geometry')
                        self.mapview.dfstream.send(pd.DataFrame(selected[['x_meters','y_meters']]))                   
                        selected.rename(columns={id_fields[i]:'identifier'},inplace=True)
                        df_all_boxes = pd.concat([df_all_boxes,selected[['identifier',box_label]]],axis=0,ignore_index=True)

                for ident in pd.unique(df_all_boxes['identifier']):
                    dfx = df_all_boxes.loc[df_all_boxes['identifier']==ident]
                    box_values = {'identifier':[ident]}
                    for bl in box_labels:
                        # returns true if any of the values are true
                        # else returns false
                        box_values[bl] = [dfx[bl].any()]
                    df_ident = pd.DataFrame.from_dict(box_values)
                    df_final = pd.concat([df_final, df_ident],axis=0)

                def summarize_boxes(row):
                    cols = list(row.axes[0])
                    s = []
                    for c in cols:
                        if 'box' in c:
                            if row.values[cols.index(c)]:
                                s.append(c.split('_')[0])
                    return ','.join(s)

                summary = df_final.copy()
                try:
                    summary['Found_In'] = summary.apply(lambda row: summarize_boxes(row),axis=1)
                    return pn.widgets.DataFrame(summary, disabled=True, fit_columns=True, width=700)
                except:
                    print('There was an error creating the final output summary table.\n')
            else:
                print('You must select at least one input dataset.\n')
        except:
            print('Something went wrong in the run_analysis() function.\n')
            return('Something went wrong in the run_analysis() function.')

       
    def view(self):
        
        desc = """This is a demonstration dashboard with incomplete functionality. Its purpose
        is to sit here and look pretty. We can put graphics and stuff in here to
        make it look all fancy."""

        logo = '.\images\logo_panel_stacked_s.png'
        
        button_desc = """The <i>Run</i> button will execute the spatial intersection and generate
        a table of identifiers found within each box and in multiple boxes.<br><br>
        Push the <i>Run</i> button after configuring all inputs and drawing boxes on the map."""

        return pn.Row(
                pn.Column(
                    '## Description',
                    desc,logo),
                pn.Column(
                    '### Configure Inputs',
                    pn.Tabs(
                        ('Input 1',self.input1),
                        ('Input 2',self.input2),
                        ('Input 3',self.input3),
                        ('Input 4',self.input4),
                        ('Input 5',self.input5)),
                    button_desc,
                    self.param['button']),
                pn.Tabs(
                    ('Map View', pn.Column(self.mapview.show_map())),
                    ('Results Table', self.run_analysis)))

d = Dashboard()
d.view().show()

Hi @dr_clank

I tried to take a look but so far without luck

Problem 1: Cannot install geoviews via pip in my Windows machine. Swith to conda

Problem 2: Conda does not work well on Windows

Had to change from

python -m panel serve 'issue_geoviews_map_extent.py' --dev
ERROR: Path for Bokeh server application does not exist: C:\repos\private\awesome-panel\scripts\'issue_geoviews_map_extent.py'

to

python -m panel serve issue_geoviews_map_extent.py --dev

Problem 3:

I get

...lib\importlib\_bootstrap.py:219: RuntimeWarning: numpy.ufunc size changed, may indicate binary incompatibility. Expected 192 from C header, got 216 from PyObject

That is my general experience with conda on Windows. It never ever works for me without problems.

Problem 4:

Now I can take a look at the app. But there is nothing I can do. So I have no chance of working with the problem.

Hi @Marc, I appreciate your effort. Thanks.

In my reply above to @philippjfr I provided a sample file called ebird_10000.csv. Put that file in a folder ‘.\sample_data\’ where the path is relative to your Jupyter Notebook (i.e. the sample_data folder is in the same directory as your Jupyter Notebook). Then launch the dashboard; select that ebird_10000.csv file in the file input dropdown, set the X and Y fields to ‘lng’ and ‘lat’ respectively, choose a column for the ID Field, and then use the BoxEdit tool to draw some boxes over Mexico (the data only covers Mexico) and then hit the ‘Run’ button.

From there you should experience my issue. When the point data is streamed back to the map via hv.streams.Buffer() the map resets and zooms to the initial extents I set in the Mapview() class. I do not want the map extent to change at this point; I want it to say where the user moved it. Or, I would like a way to programmatically set the map where I want it to go.

1 Like

Ah. Ok. I did not get it should be in a subfolder.

Just a hint if you only have one file of sample_data you will not be able to select anything.

You can solve this by adding a copy to the sample_data folder

image

Next problem.

When I have the selection below and click run nothing happens on the map.

But I get an error in the terminal.

image

Ahh. Ok. So you want me to first draw some boxes using the Box Edit Tool.

Ahh. Ok. So I need to double click in order for the Box Edit Tool to work. That took some time to figure out :slight_smile:

Ahh. I should enable getting better error messages. Seeing the stack trace.

After all that I still get errors.

I would need some more specific guidance on the precise steps I need to take in order to help.

And I would like to help. Because I think your dashboard could be really, really great. And I could learn something from it. And others could as well.

1 Like

Just a hint if you only have one file of sample_data you will not be able to select anything.

I have more than one file locally but yes, that’s kind of annoying. What I’d really like to do is have the value of the param.FileSelector() set when it reads the list of files. It just seems to populate the widget’s label/display with the filename but the value of the widget remains null. But that’s off topic for this thread.

@Marc Hmmm, unfortunately I’m not sure what’s going on there. It seems that there’s a problem with the field you set as the ID field – I’ll deal with that separately, thanks for pointing it out. When I set the fields like so it seems to work. What happens when you try this?

Input File: ebird_10000.csv
X Field: lng
Y Field: lat
ID field: comName

And then draw boxes. For the BoxEdit tool you can hold shift + drag your mouse on the map to draw a box, or you can double click as per https://holoviews.org/reference/streams/bokeh/BoxEdit.html

I’ve been drawing boxes on the coastlines of the Yucatan in Eastern Mexico, and on the coastlines of the Baja peninsula in the West. It seems to work well.

This is unrelated to my extents problem, but since you seem to like the idea of this dashboard (thank you, by the way :slightly_smiling_face:
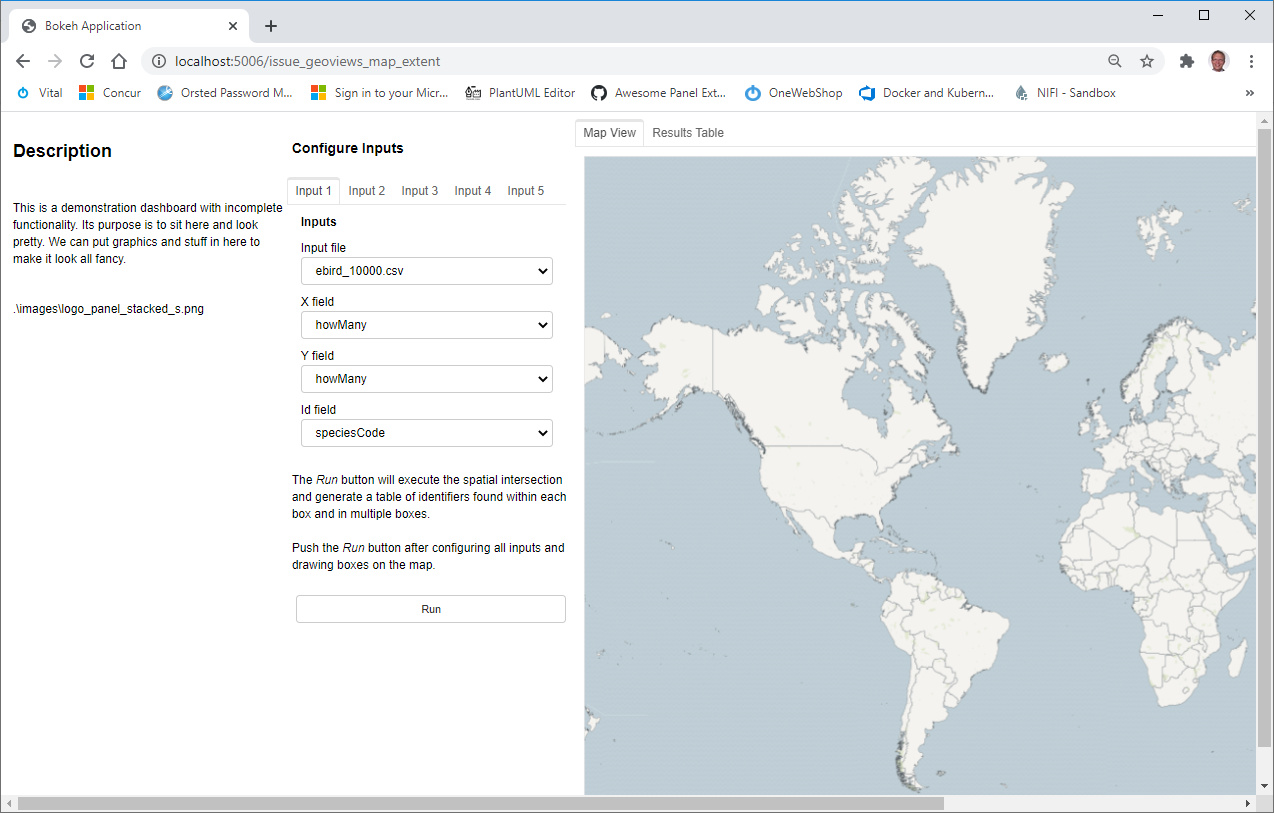
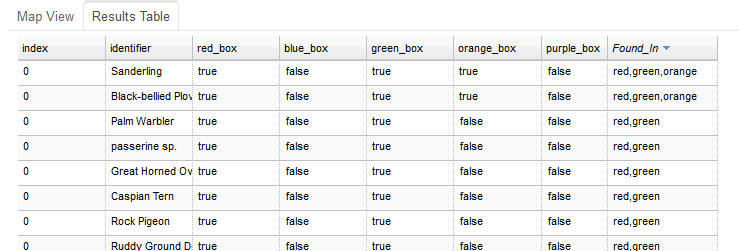
) if you switch tabs above the map after you get results you will see a summary table which describes which birds were found in which boxes; you can sort the columns by clicking them. In this summary table, the values of the ‘identifier’ column come from the field the user selects as the ID field; in the example below I have used comName which displays the common name of the birds. The idea is that users can use whichever data they like, query it by drawing boxes, and find out which data values (identifiers) are in which locations.

1 Like

But in my version there are no green dots. Should they be draw initially after having selected the Input File. Or only after having clicked Run?

Ok. After having drawn some boxes and clicked the Run button I see some green dots. And also the chart resets the zoom

But in my version there are no green dots. Should they be draw initially after having selected the Input File. Or only after having clicked Run?

As you’ve discovered, the green dots only appear after configuring (select input file, selecting fields, drawing boxes) and pushing ‘Run’. Thanks for you persistence!

1 Like

Would you not want the dots to show up initially? (After having selected a file?)

@Marc Can you clarify what you mean by this? When I switch to the chart tab, sort fields, switch back to the map, the map zoom seems unchanged. Does switching to the chart and back to the map change the map extent for you?

What I mean is that when I load the application. And even after having selected in the drop down boxes it looks like

I.e. no green dots.

I would expect there to be some green dots that I then would like to draw boxes around. How do you determine where to draw boxes without the green dots?

Would you not want the dots to show up initially? (After having selected a file?)

No, I only want the dots to appear after hitting the Run button. As it is now the functionality is incomplete compared to my full set of requirements. In a later version the inputs will be a combination of local files provided by the user and/or a REST services which will be queried when ‘Run’ is pushed. The services I will query contain A LOT of data so I don’t want to try to retrieve it and plot it. This dashboard will also serve the purpose of querying the various data sources.

I would expect there to be some green dots that I then would like to draw boxes around. How do you determine where to draw boxes without the green dots?

When this dashboard is complete it will query some REST services which have data with global distribution; the current local ebird data in Mexico is just for testing. When connected to the REST services it would be impractical to download hundreds of millions (sometimes billions) of rows of data to plot on the map before the user even draws their boxes. So in the final version the user can draw boxes anywhere they want; if there’s no data within a box that’s fine.