How do you set the height of a plot when using hvplot, panel.ReactiveExpr and pn.panel? I’ve tried to insert height argument to multiple places but they do not seem to have any effect.
- The panel.ReactiveExpr mention
widget_layout but I’m not sure if you can pass height there somehow
- The
.opts(height=800) I took from Holoviews Customizing Plots. I’m not sure if these are holoviews objects but it has .opts function which accepts args. That does not seem to have any effect, though.
- I also tried giving args to
pn.panel just because it is the last step which creates the graph. It also takes sizing_mode="strecth_width", but not height does not have any effect. This by the way accepts height arguments which works if the input is not ReactiveExpr but simply combined_scatter = data1.hvplot.scatter() * data2.hvplot.scatter() (where data1 and data2 are pandas Series). Could not find the docs for this one.
Code for MWE
import hvplot.pandas
import pandas as pd
import numpy as np
import panel as pn

pn.extension(sizing_mode="stretch_width", template="fast")

data1 = pn.rx(pd.DataFrame(dict(a=np.random.randn(100), b=np.random.randn(100))))
data2 = pn.rx(pd.DataFrame(dict(a=np.random.randn(100), b=np.random.randn(100))))

slider = pn.widgets.IntRangeSlider(
    name="rande for b",
    start=0,
    end=100,
    value=(0, 100),
    step=10,
).servable(area="sidebar")

data1 = data1[data1["b"].between(slider.value[0], slider.value[1])]["a"]
data2 = data2[data2["b"].between(slider.value[0], slider.value[1])]["a"]


combined_scatter = data1.hvplot.scatter() * data2.hvplot.scatter()
combined_scatter.opts(height=800)  # has no effect
combined_plot = pn.ReactiveExpr(
    combined_scatter,
    height=800,  # has no effect
)
graph_panel = pn.panel(
    combined_plot,
    sizing_mode="stretch_width",
    height=800,  # has no effect
)

graph_panel.servable(
    title="My Title",
    # does not take height argument
)
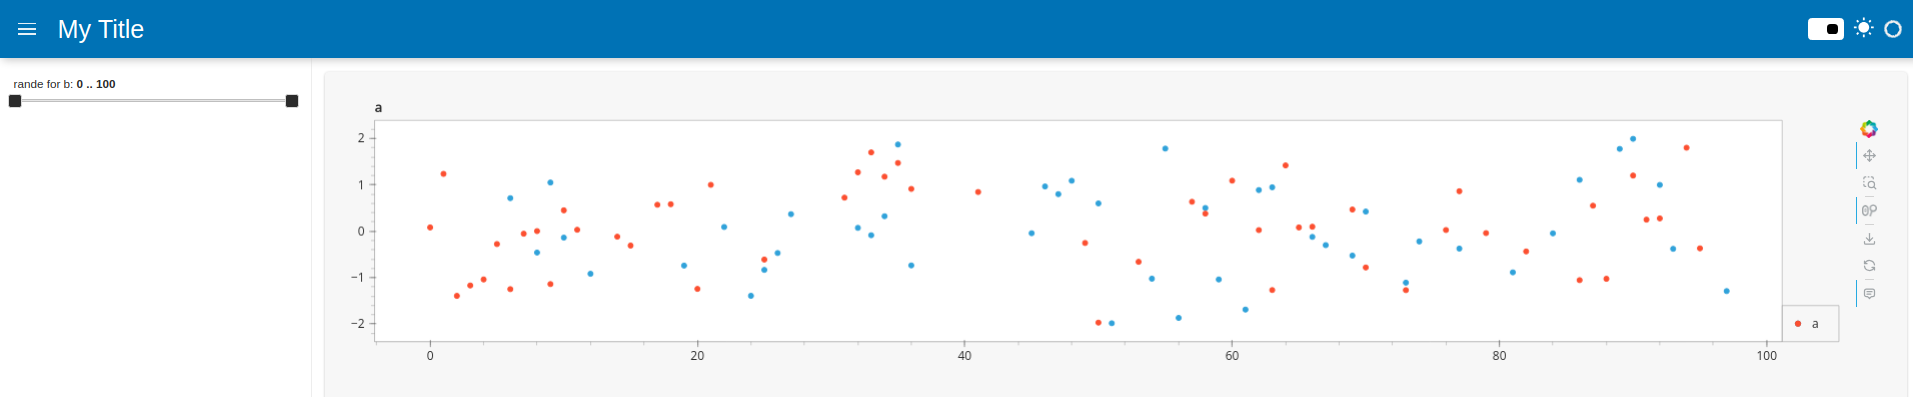
This produces
Question(s)
- How to set the height of the plot?
- why
pn.panel does not accept, or ignores, height with interactive graphs? (but works well if the graph is not tied to any widget)
Okay, some progress. Seems that the .opts has no effect as the combined_scatter is of type param.reactive.rx (created with panel.rx). But there is a private attribute called ._current which stores the Overlay object, which has the opts() method which can be called and works.
>>> combined_scatter
:Overlay
   .Scatter.A.I  :Scatter   [index]   (a)
   .Scatter.A.II :Scatter   [index]   (a)
>>> type(combined_scatter)
param.reactive.rx
>>> combined_scatter._current
:Overlay
   .Scatter.A.I  :Scatter   [index]   (a)
   .Scatter.A.II :Scatter   [index]   (a)
>>> type(combined_scatter._current)
holoviews.core.overlay.Overlay
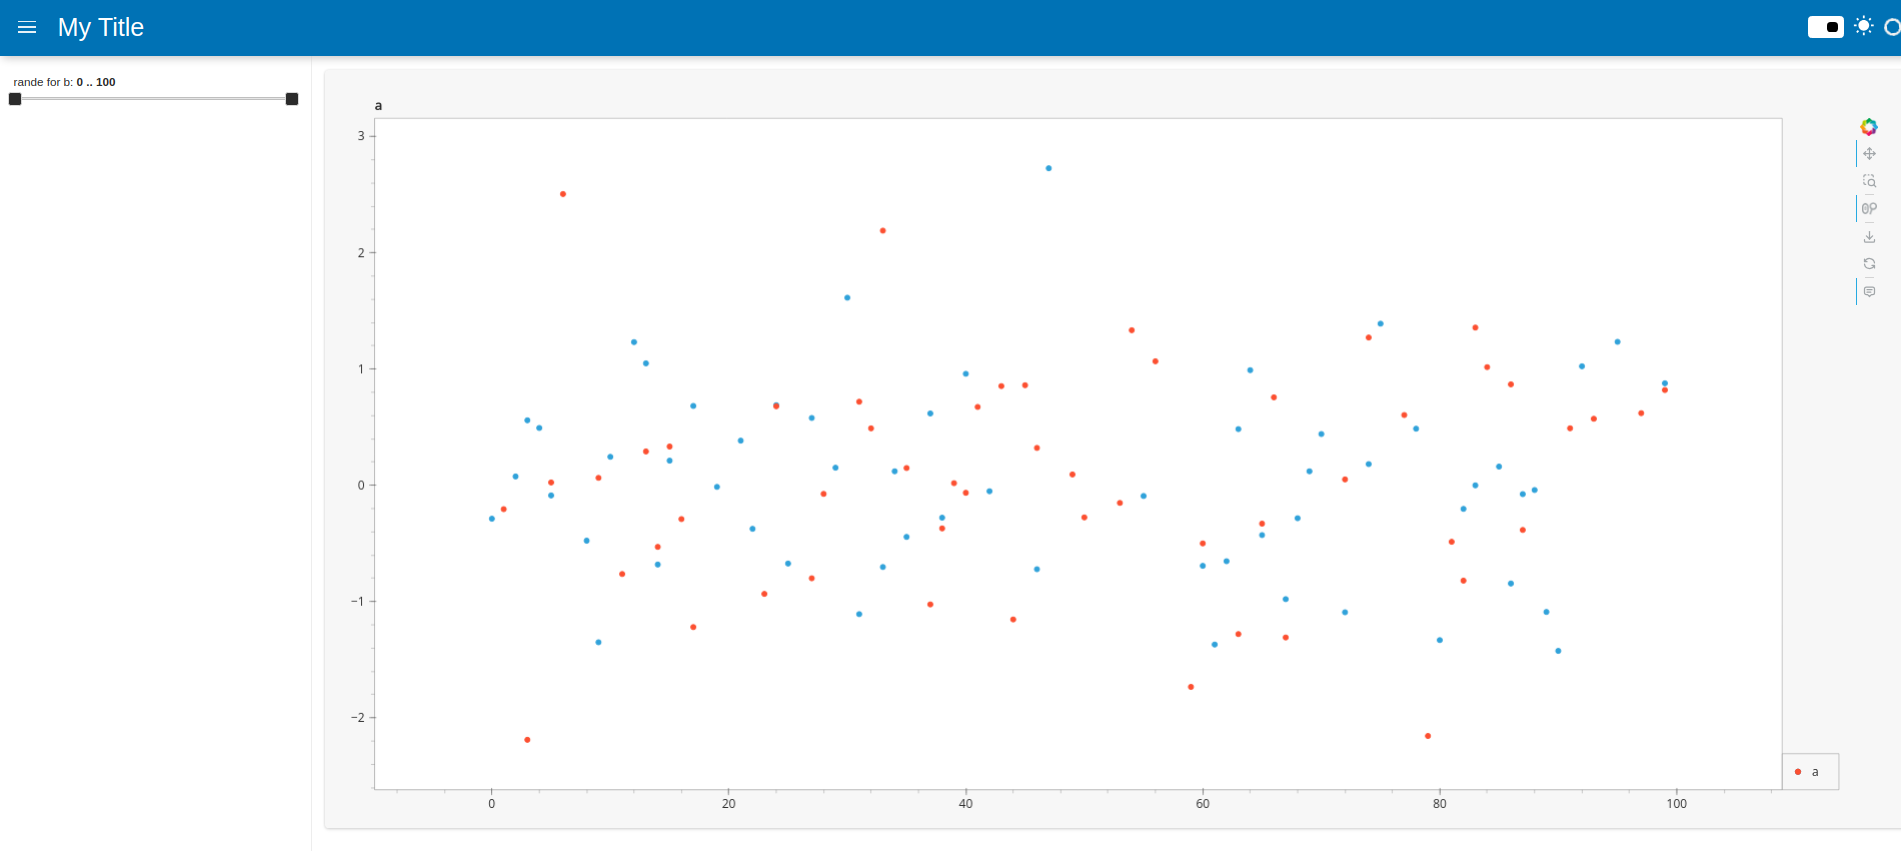
Therefore, using
combined_scatter._current.opts(height=800)
instead of
combined_scatter.opts(height=800)
works. Now I get a graph of height 800:
But I feel a bit dirty using a private attribute. What would be the correct way to accomplish this?
Adding some debugging details
Edit: I can also see that the ReactiveExpr object has a layout. It even has a height of 810 but for some reason that height is not used after passing the object to pn.panel.
>>> type(combined_plot.layout)
panel.layout.base.Row
>>> combined_plot.layout
Row(height=810, sizing_mode='stretch_width')
    [0] Row(sizing_mode='stretch_width')
        [0] ParamFunction(function, _pane=HoloViews, defer_load=False, sizing_mode='stretch_width')
>>> combined_plot.layout.height
810
What does pn.panel do?
- It should return a displayable Panel object.
- pn.panel does nothing to
panel.param.ReactiveExpr objects, as can seen in panel/pane/base.py which starts with:
    if isinstance(obj, (Viewable, ServableMixin)):
        return obj
The ReactiveExpr is subclass of both Viewable and ServableMixin. Therefore:
>>> combined_plot is  pn.panel(
        combined_plot,
        sizing_mode="stretch_width",
       )
True
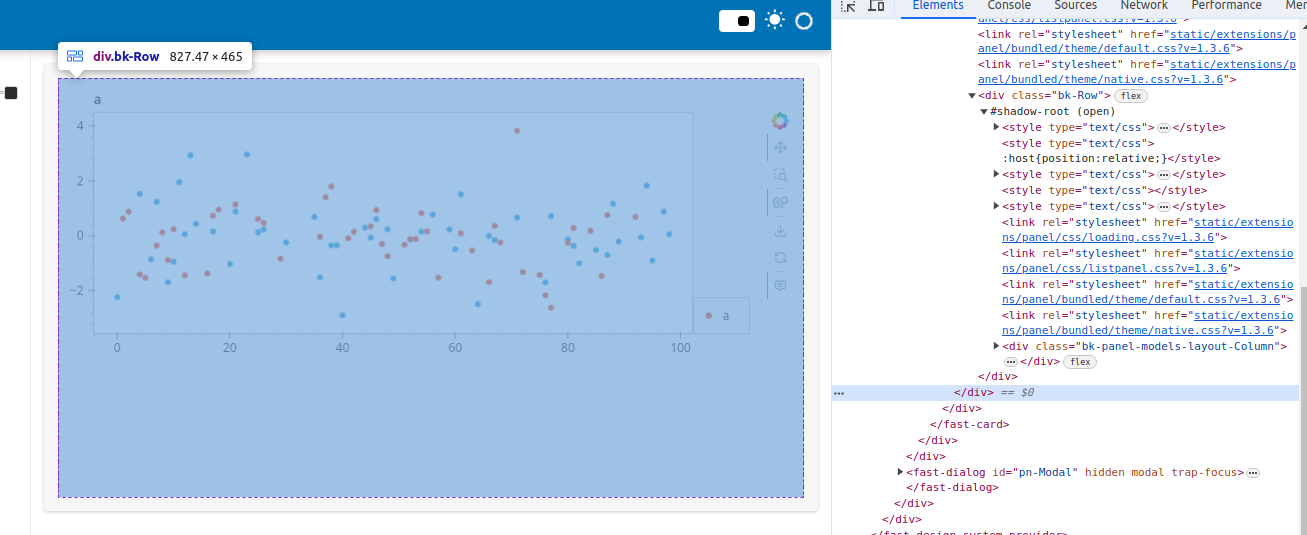
What does the height in pn.ReactiveExpr do?
- This has some effect. It changes the outer
div.bk-Row height in the html (which will be height+10). So, setting height=455 gives an outer div with height of 465 (always height+10):
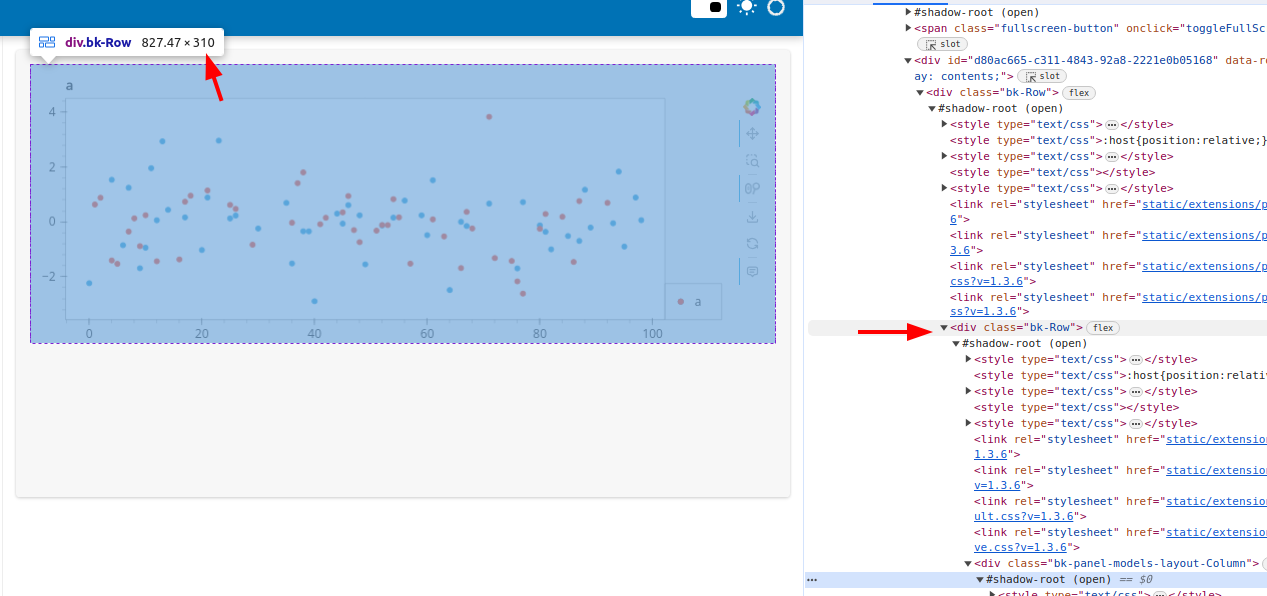
- Then there is another
div.bk-Row which has always height of 310:
- This in turn has
bk-panel-models-layout-Column inside it with height of 310, and this has div.bk-Figure inside of it with always height of 300 and margin of 5.
The combined_scatter , which is of type param.reactive.rx, created in
combined_scatter = data1.hvplot.scatter() * data2.hvplot.scatter()
has also a public method called register_display_handler. I’m not sure if that’s the supposed to be used, but this seems to also do the trick:
def display_handler(overlay, **_):
    overlay.opts(height=800)
    return overlay

combined_scatter.register_display_handler(
    lambda x: isinstance(x, holoviews.core.overlay.Overlay),
    display_handler,
)
And I’m not sure if the _display_handlers are meant to be copied over to new rx instances (for example when it’s cloned). If not, the above could be also:
def display_handler(overlay, **_):
    overlay.opts(height=800)
    return overlay

combined_scatter.register_display_handler(
    lambda x: True,
    display_handler,
)
What I do not understand is that why the
combined_scatter.opts(height=800)
call does not work directly. Could someone confirm that (1) should the combined_scatter.opts(height=800) call work? (2) What is the API that is expected to be used for setting height for an interactive graph?