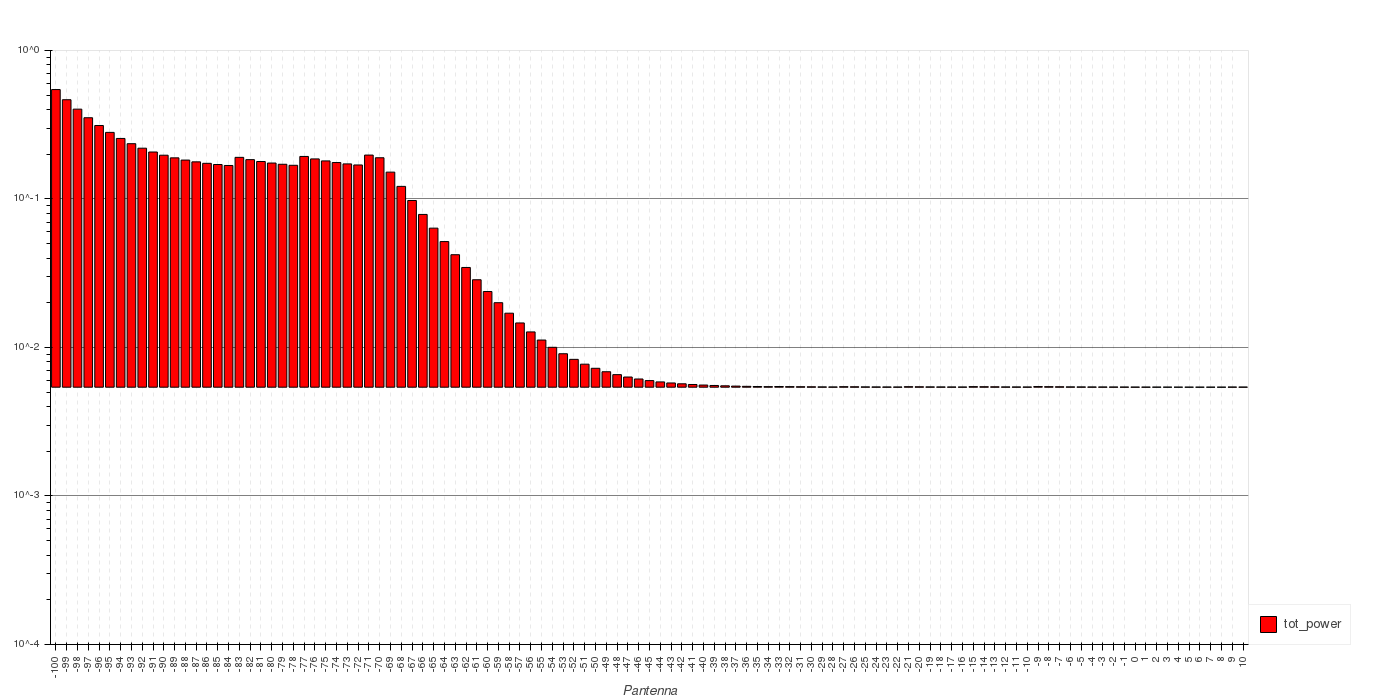
In a hvplot.bar() and using a logy=True, I want to set the value of the bottom of the bars. Currently it seems to be set to max_value of all bars divided by 1000.
This means that setting a large range for the yscale from say 0.000001 to 1, all the bars start somewhere in the middle of the plot and even worse, small numbers are not shown