The trick is to use ‘value’ in the tooltip:
import hvplot.pandas
import numpy as np
import pandas as pd
index = pd.date_range("2020-07-01", "2021-07-01", freq="D")
data = np.random.random((index.size, 4)) + 10 * np.arange(4)[np.newaxis, :]
df = pd.DataFrame(data, index=index, columns=list("ABCD"))
# Using custom models
from bokeh.models import DatetimeTickFormatter, HoverTool
# https://docs.bokeh.org/en/2.4.1/docs/reference/models/formatters.html#datetimetickformatter
tickfmt = DatetimeTickFormatter(years="%m-%d", months="%m-%d")
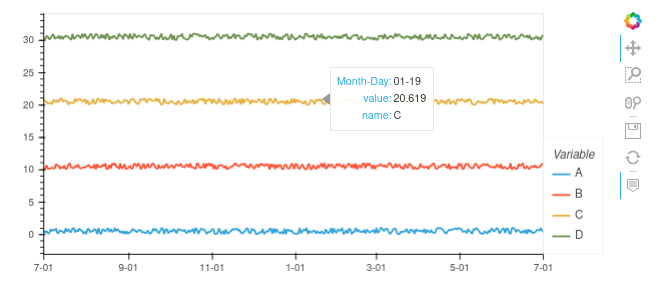
tooltips = [
("Month-Day", "@index{%m-%d}"),
("value", "@value"),
("name", "@Variable")
]
hover = HoverTool(tooltips=tooltips, formatters={"@index": "datetime"})
df.hvplot(xformatter=tickfmt, tools=[hover])