achen
September 25, 2022, 1:49pm
1
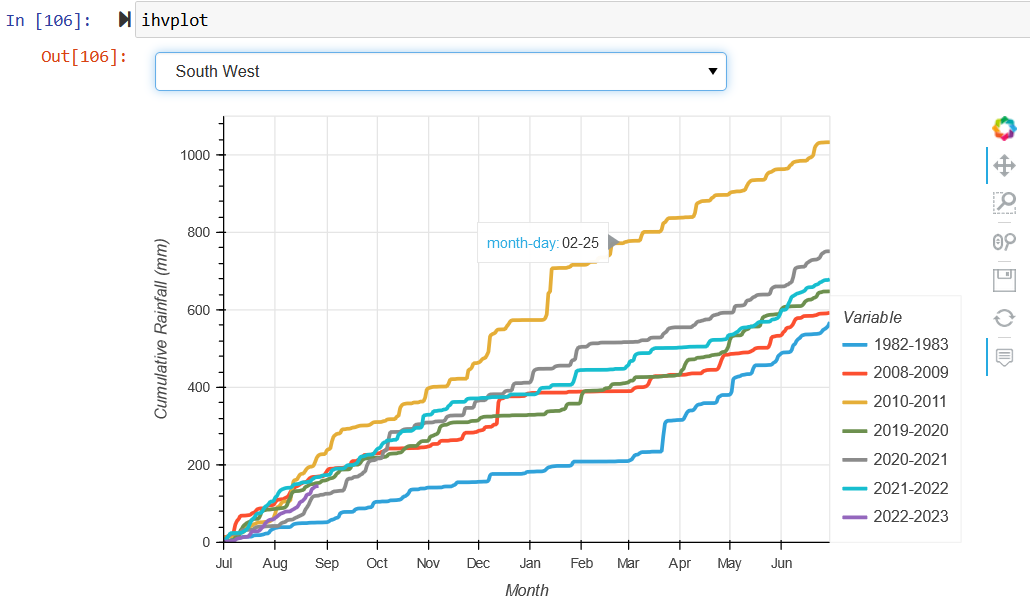
I was trying to add a hovering tooltip to each of the lines plotted with hvPlot.
The Dataframe looks like:
        Month-Day-3 regions 	1982-1983 	    2008-2009 	    2010-2011 	    2019-2020 	    2020-2021 	    2021-2022 	    2022-2023
365 	1900-07-01 	South West 	0.2263919000 	12.5141000000 	6.6907450000 	2.4357917000 	0.5901663300 	0.1001446200 	1.0919017000
366 	1900-07-02 	South West 	0.2514822800 	13.8615330000 	12.2373830000 	3.6159074000 	8.7875630000 	1.4974693000 	1.9742589000
367 	1900-07-03 	South West 	0.4882140200 	14.4603040000 	14.9851780000 	4.1348520000 	12.7190895000 	11.5023140000 	2.4423716000
368 	1900-07-04 	South West 	1.4404917000 	15.3638480000 	15.6692705000 	4.3111353000 	17.7306600000 	16.1637740000 	2.7225597000
369 	1900-07-05 	South West 	3.5807664000 	15.3754170000 	15.7712230000 	4.3848157000 	19.6496050000 	23.4813460000 	3.1032538000
370 	1900-07-06 	South West 	7.8110630000 	15.6621120000 	15.7997120000 	4.4555316000 	21.3921930000 	24.0971810000 	3.2181490000
371 	1900-07-07 	South West 	9.4692700000 	25.7376730000 	16.4730300000 	5.2979030000 	22.1507600000 	24.1890100000 	3.7347070000
372 	1900-07-08 	South West 	10.3100510000 	45.7029650000 	16.6521340000 	13.1908170000 	22.3775860000 	24.2017360000 	6.1997110000
373 	1900-07-09 	South West 	10.5075210000 	55.3129430000 	16.6757770000 	14.5884300000 	22.4045560000 	24.2094000000 	9.5680410000
   ... ...
727 	1901-06-28 	South West 	554.2284500000 	590.9046000000 	1,032.5052000000 	647.4787000000 	751.0833000000 	677.0237000000 	NaN
728 	1901-06-29 	South West 	558.6062000000 	591.6897600000 	1,032.5798000000 	647.6735000000 	751.1294600000 	677.0494400000 	NaN
729 	1901-06-30 	South West 	568.5926000000 	592.7527500000 	1,032.6202000000 	647.7038000000 	751.1875000000 	678.8912400000 	NaN
I was trying to plot multiple columns as Y asix with hvPlot and use hover tooltip to show the value of the column when mouse hovering on the individual line for the column.
highlighted_years = ['1982-1983', '2008-2009', '2010-2011', '2019-2020', '2020-2021', '2021-2022', '2022-2023']

tooltips = [
    ("month-day", "@{Month-Day-3}{%m-%d}")
]

hover = HoverTool(tooltips=tooltips, formatters={"@{Month-Day-3}": "datetime"})

tickfmt = DatetimeTickFormatter(months="%b")

ihvplot = ipipeline.hvplot(x='Month-Day-3', y=highlighted_years,
                                xlabel='Month', ylabel='Cumulative Rainfall (mm)',
                                xformatter=tickfmt, tools=[hover], ylim=(0,1100),
                                line_width=3, height=400, width=700, grid=True,
                                xticks=DatetimeTicker(desired_num_ticks=12))
ihvplot
I would like to show “month-day” and the “value” of the column when mouse is hovering on the individual line (column). I am assuming I will need to set up the tooltips to achieve this?
Marc
September 25, 2022, 4:56pm
2
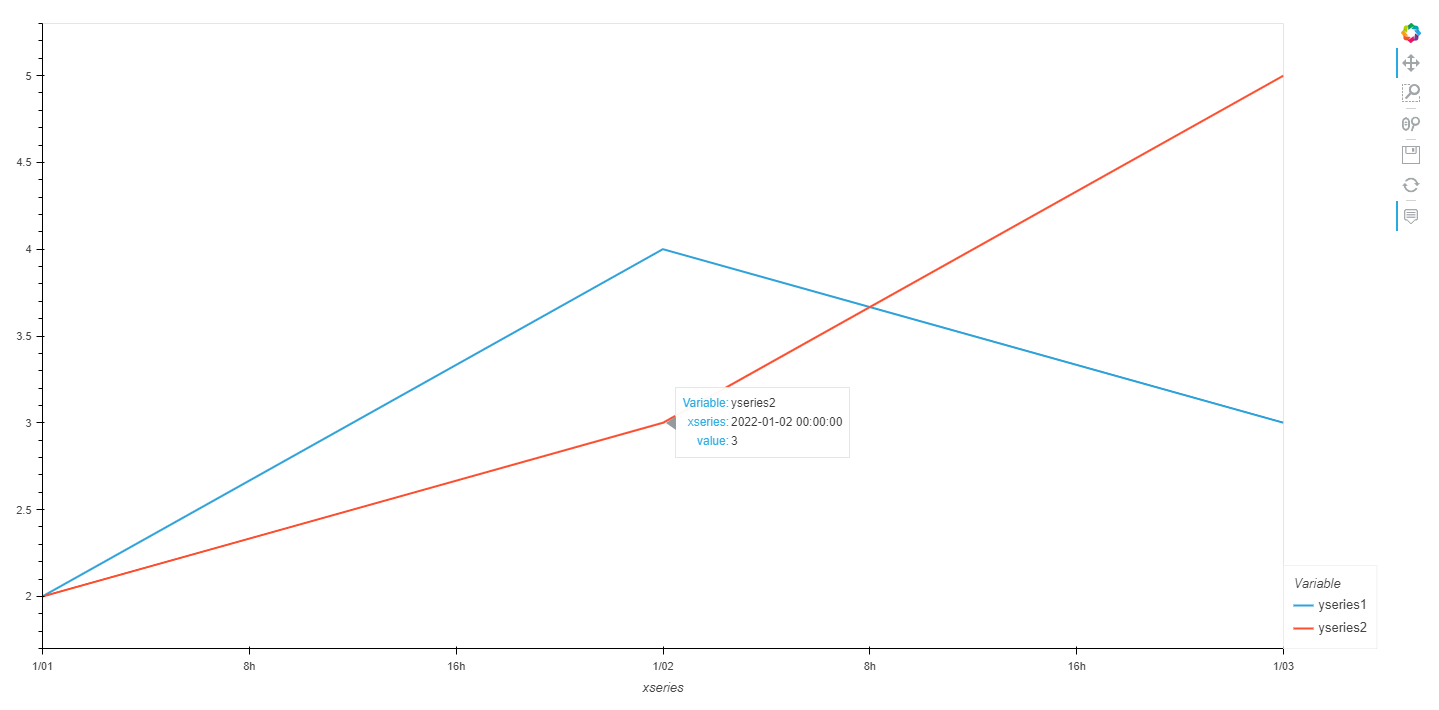
Without setting the hover tools you already get the information you are asking for.
import hvplot.pandas
import pandas as pd

df = pd.DataFrame({
    "xseries": pd.date_range("2022-01-01", "2022-01-03"),
    "yseries1": [2,4,3],
    "yseries2": [2,3,5],
    "some_label": ["A", "B", "C"]
})

plot = df.hvplot(x="xseries", y=["yseries1", "yseries2"])

import panel as pn

pn.panel(plot, sizing_mode="stretch_both").servable()
My guess is that you need to customize the hover values as described in Plotting with Bokeh — HoloViews v1.15.0 .
Please write a bit more about what you are trying to achieve.
1 Like
achen
September 26, 2022, 12:09am
3
Thanks @Marc .
Yes I need to customize the hover values. The “Month-Day-3” column is a datetime type but I only need to show month and day. So I do need to set up the hover tool and show the value of the column where the mouse is hovering on the individual line (column).
I did read through the HoloViews tutorial as you pointed, but I am still unable to figure out how to achieve this.
Hoxbro
September 26, 2022, 7:33am
4
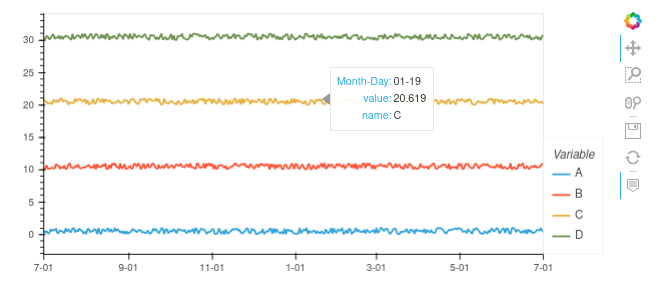
The trick is to use ‘value’ in the tooltip:
import hvplot.pandas
import numpy as np
import pandas as pd

index = pd.date_range("2020-07-01", "2021-07-01", freq="D")
data = np.random.random((index.size, 4)) + 10 * np.arange(4)[np.newaxis, :]
df = pd.DataFrame(data, index=index, columns=list("ABCD"))

# Using custom models
from bokeh.models import DatetimeTickFormatter, HoverTool

# https://docs.bokeh.org/en/2.4.1/docs/reference/models/formatters.html#datetimetickformatter
tickfmt = DatetimeTickFormatter(years="%m-%d", months="%m-%d")

tooltips = [
    ("Month-Day", "@index{%m-%d}"),
    ("value", "@value"),
    ("name", "@Variable")
]
hover = HoverTool(tooltips=tooltips, formatters={"@index": "datetime"})

df.hvplot(xformatter=tickfmt, tools=[hover])
3 Likes
Hoxbro
November 29, 2023, 5:45pm
6
Can you share a minimal, reproducible example (MRE) ?
In general, a complete script only with the essential code, which can be copied/pasted and immediately run as-is with no modifications. This is much more useful than snippets.
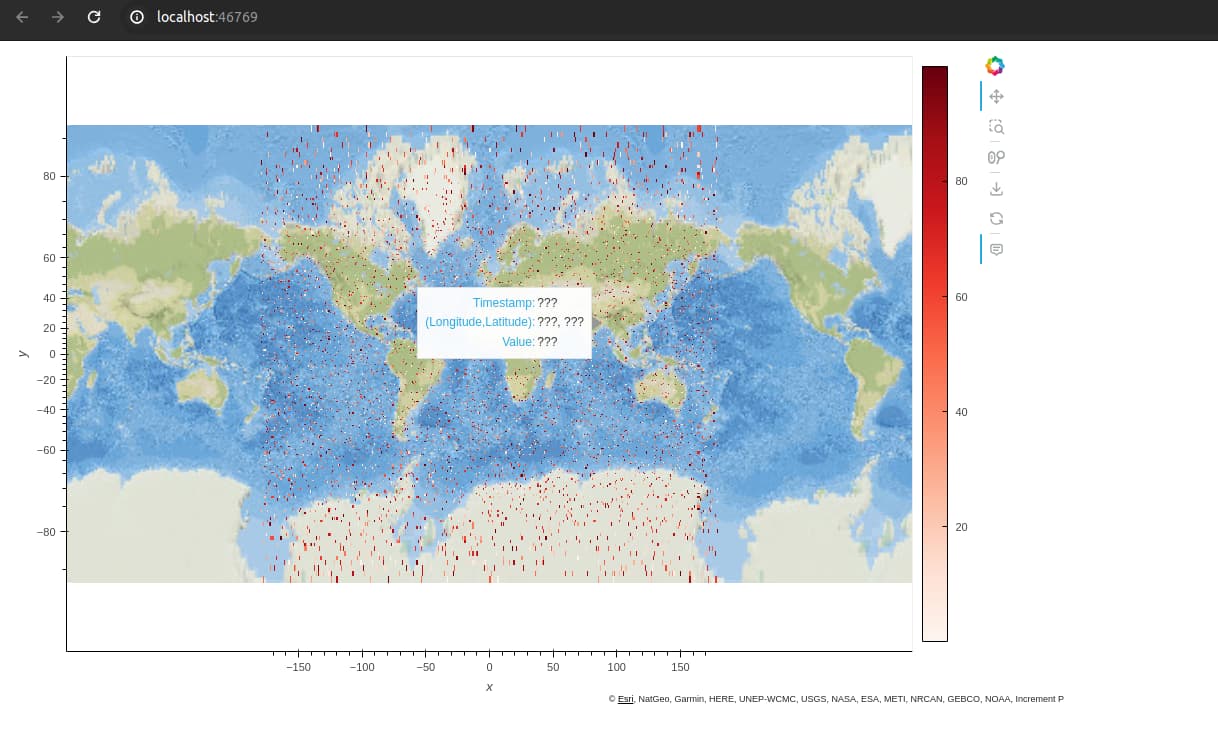
Hi, I’m facing the same issue. Below is the minimal reproducible example.
import pandas as pd
import hvplot.pandas
import numpy as np
from bokeh.models import HoverTool
import holoviews as hv
import hvplot
import panel as pn
import geoviews as gv
gv.extension('bokeh')

# Create a dummy DataFrame
np.random.seed(0)
n = 10000  # number of points
df = pd.DataFrame({
    'Longitude': np.random.uniform(-180, 180, n),
    'Latitude': np.random.uniform(-90, 90, n),
    'Timestamp': pd.date_range(start='2023-01-01', periods=n, freq='D'),
    'Value': np.random.rand(n) * 100  # This will represent 'selected_col'
})


selected_col = 'Value'
tile = hv.element.tiles.EsriNatGeo().opts(width=1000, height=650)
hover = HoverTool(tooltips=[
                            ("Timestamp","@Timestamp"),
                            ("(Longitude,Latitude)", "@Longitude, @Latitude"),
                            (selected_col,f"@{{selected_col}}{{0.0}}")
                        ], formatters={"@{Timestamp}": "datetime"})
plot = df.hvplot.points(
    'Longitude', 'Latitude',
    geo=True,
    tiles=tile,
    tools=[hover],
    c=selected_col,
    cmap='Reds',
    colorbar=True,
    rasterize=True,
    dynamic=False,
)
hvplot.show(plot)
How to make hover cols work?
1 Like
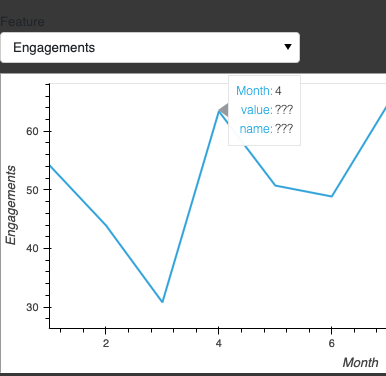
For some reason, “@value ” & “@name ” don’t work at all for the following dataset.
import holoviews as hv
import hvplot.pandas
import numpy as np
import panel as pn
import pandas as pd

from bokeh.models import HoverTool

# generation of random data
engagements = np.random.normal(50,10,12)
engagement_r8 = np.random.normal(2,0.30,12)
months = range(1,13)

df = pd.DataFrame({'Month':months,
                   'Engagements':engagements,
                   'Engagement R8': engagements})

cols = list(df.columns)
cols.remove('Month')

# hv setup
feature = pn.widgets.Select(options=cols, name='Feature')

def plotter(feature):
  scope = df[['Month',feature]]
  return scope

# Bokeh Hovertool setup
tooltips = [("Month", "@Month"),
            ("value", "@value"),
            ("name", "@Variable")]

hover_tool = HoverTool(tooltips=tooltips)

# creation of hv GUI
df_i = hvplot.bind(plotter, feature).interactive()

df_i.hvplot.line(x='Month', y=feature).opts(tools=[hover_tool])
Reults in
It should reference @Engagements I think
Apparently, both @value & @Variable are dynamic and should adjust to any column fed into the graph.
# Bokeh Hovertool setup
tooltips = [("Month", "@Month"),
            ("value", "@value"),
            ("name", "@Variable")]
Perhaps that’s only for the vanilla hvplot call, not interactive
1 Like
Hi Andrew, Do you have solution for this?
Hi, I’m facing the same issue. Below is the minimal reproducible example.
import pandas as pd
import hvplot.pandas
import numpy as np
from bokeh.models import HoverTool
import holoviews as hv
import hvplot
import panel as pn
import geoviews as gv
gv.extension('bokeh')
# Create a dummy DataFrame
np.random.seed(0)
n = 10000 # number of points
df = pd.DataFrame({
'Longitude': np.random.uniform(-180, 180, n),
'Latitude': np.random.uniform(-90, 90, n),
'Timestamp': pd.date_range(start=…
That makes sense. Thank you.
Something along the lines of:@x and @y is in mercator, so it’s not very helpful and I forgot how HoloViews/hvPlot does it internally. Also, timestamp is dropped upon rasterize.
Can you submit an issue on hvplot regarding this?
import pandas as pd
import hvplot.pandas
import numpy as np
from bokeh.models import HoverTool
import holoviews as hv
import hvplot
import panel as pn
import geoviews as gv
from holoviews.operation.datashader import rasterize

gv.extension("bokeh")

# Create a dummy DataFrame
np.random.seed(0)
n = 10000  # number of points
df = pd.DataFrame(
    {
        "Longitude": np.random.uniform(-180, 180, n),
        "Latitude": np.random.uniform(-90, 90, n),
        "Timestamp": pd.date_range(start="2023-01-01", periods=n, freq="D"),
        "Value": np.random.rand(n) * 100,  # This will represent 'selected_col'
    }
)
display(df)

selected_col = "Value"
tile = hv.element.tiles.EsriNatGeo().opts(width=1000, height=650)
hover = HoverTool(
    tooltips=[
        ("Timestamp", "@Timestamp"),
        ("(Longitude,Latitude)", "@x, @y"),
        (selected_col, f"@{{image}}{{0.0}}"),
    ]
)
plot = df.hvplot.points(
    "Longitude",
    "Latitude",
    hover_cols=["Timestamp"],
    geo=True,
    tools=[hover],
    c=selected_col,
    cmap="Reds",
    colorbar=True,
    dynamic=False,
)
hvplot.show(plot)
Looking at GeoViews internals, it uses CustomJSHover to handle Mercator projections.
import pandas as pd
import hvplot.pandas
import numpy as np
from bokeh.models import HoverTool
import holoviews as hv
import hvplot
import panel as pn
import geoviews as gv
from holoviews.operation.datashader import rasterize
from bokeh.models import CustomJSHover

gv.extension("bokeh")

# Create a dummy DataFrame
np.random.seed(0)
n = 10000  # number of points
df = pd.DataFrame(
    {
        "Longitude": np.random.uniform(-180, 180, n),
        "Latitude": np.random.uniform(-90, 90, n),
        "Timestamp": pd.date_range(start="2023-01-01", periods=n, freq="D"),
        "Value": np.random.rand(n) * 100,  # This will represent 'selected_col'
    }
)
display(df)

_hover_code = """
    const projections = Bokeh.require("core/util/projections");
    const {snap_x, snap_y} = special_vars
    const coords = projections.wgs84_mercator.invert(snap_x, snap_y)
    return "" + (coords[%d]).toFixed(4)
"""

selected_col = "Value"
tile = hv.element.tiles.EsriNatGeo().opts(width=1000, height=650)
hover = HoverTool(
    tooltips=[
        ("Timestamp", "@Timestamp"),
        ("(Longitude,Latitude)", "$x{custom}, $y{custom}"),
        (selected_col, f"@image{{0.0}}"),
    ],
    formatters={
        "$x": CustomJSHover(code=_hover_code % 0),
        "$y": CustomJSHover(code=_hover_code % 1),
    },
)
plot = df.hvplot.points(
    "Longitude",
    "Latitude",
    hover_cols=["Timestamp"],
    geo=True,
    tools=[hover],
    c=selected_col,
    cmap="Reds",
    colorbar=True,
    dynamic=False,
    rasterize=True,
)
hvplot.show(plot)
Still can’t get Timestamp to work though; would be great if you can report that to the hvplot issues.
I created an issue on hvplot.
opened 02:38PM - 01 Dec 23 UTC
#### ALL software version info
Name Version … Build Channel
_libgcc_mutex 0.1 conda_forge conda-forge
_openmp_mutex 4.5 2_gnu conda-forge
asttokens 2.4.1 pyhd8ed1ab_0 conda-forge
attrs 23.1.0 pyh71513ae_1 conda-forge
bleach 6.1.0 pyhd8ed1ab_0 conda-forge
blosc 1.21.5 h0f2a231_0 conda-forge
bokeh 3.3.1 pyhd8ed1ab_0 conda-forge
boto3 1.29.5 pyhd8ed1ab_0 conda-forge
botocore 1.32.5 pyhd8ed1ab_0 conda-forge
branca 0.7.0 pyhd8ed1ab_1 conda-forge
brotli 1.1.0 hd590300_1 conda-forge
brotli-bin 1.1.0 hd590300_1 conda-forge
brotli-python 1.1.0 py311hb755f60_1 conda-forge
bzip2 1.0.8 h7b6447c_0
c-ares 1.22.1 hd590300_0 conda-forge
ca-certificates 2023.08.22 h06a4308_0
cairo 1.18.0 h3faef2a_0 conda-forge
cartopy 0.22.0 py311h320fe9a_1 conda-forge
certifi 2023.11.17 py311h06a4308_0
cfitsio 4.3.0 hbdc6101_0 conda-forge
cftime 1.6.3 py311h1f0f07a_0 conda-forge
charset-normalizer 3.3.2 pyhd8ed1ab_0 conda-forge
click 8.1.7 unix_pyh707e725_0 conda-forge
click-plugins 1.1.1 py_0 conda-forge
cligj 0.7.2 pyhd8ed1ab_1 conda-forge
cloudpickle 3.0.0 pyhd8ed1ab_0 conda-forge
colorama 0.4.6 pyhd8ed1ab_0 conda-forge
colorcet 3.0.1 pyhd8ed1ab_0 conda-forge
comm 0.1.4 pyhd8ed1ab_0 conda-forge
connectorx 0.3.2 py311h4aa2743_3 conda-forge
contourpy 1.2.0 py311h9547e67_0 conda-forge
cycler 0.12.1 pyhd8ed1ab_0 conda-forge
dask-core 2023.11.0 pyhd8ed1ab_0 conda-forge
datashader 0.16.0 pyhd8ed1ab_0 conda-forge
debugpy 1.8.0 py311hb755f60_1 conda-forge
decorator 5.1.1 pyhd8ed1ab_0 conda-forge
et_xmlfile 1.1.0 py311h06a4308_0
exceptiongroup 1.2.0 pyhd8ed1ab_0 conda-forge
executing 2.0.1 pyhd8ed1ab_0 conda-forge
expat 2.5.0 hcb278e6_1 conda-forge
fiona 1.9.5 py311hbac4ec9_0 conda-forge
folium 0.15.0 pyhd8ed1ab_0 conda-forge
font-ttf-dejavu-sans-mono 2.37 hab24e00_0 conda-forge
font-ttf-inconsolata 3.000 h77eed37_0 conda-forge
font-ttf-source-code-pro 2.038 h77eed37_0 conda-forge
font-ttf-ubuntu 0.83 hab24e00_0 conda-forge
fontconfig 2.14.2 h14ed4e7_0 conda-forge
fonts-conda-ecosystem 1 0 conda-forge
fonts-conda-forge 1 0 conda-forge
fonttools 4.45.0 py311h459d7ec_0 conda-forge
freetype 2.12.1 h267a509_2 conda-forge
freexl 2.0.0 h743c826_0 conda-forge
fsspec 2023.10.0 pyhca7485f_0 conda-forge
gdal 3.7.2 py311h815a124_5 conda-forge
geopandas 0.14.1 pyhd8ed1ab_0 conda-forge
geopandas-base 0.14.1 pyha770c72_0 conda-forge
geos 3.12.0 h59595ed_0 conda-forge
geotiff 1.7.1 hee599c5_13 conda-forge
geoviews 1.11.0 pyhd8ed1ab_0 conda-forge
geoviews-core 1.11.0 pyha770c72_0 conda-forge
gettext 0.21.1 h27087fc_0 conda-forge
giflib 5.2.1 h0b41bf4_3 conda-forge
greenlet 3.0.1 py311hb755f60_0 conda-forge
hdf4 4.2.15 h501b40f_6 conda-forge
hdf5 1.14.2 nompi_h4f84152_100 conda-forge
holoviews 1.18.1 pyhd8ed1ab_0 conda-forge
hvplot 0.9.0 pyhd8ed1ab_0 conda-forge
icu 73.2 h59595ed_0 conda-forge
idna 3.4 pyhd8ed1ab_0 conda-forge
importlib-metadata 6.8.0 pyha770c72_0 conda-forge
importlib_metadata 6.8.0 hd8ed1ab_0 conda-forge
ipykernel 6.26.0 pyhf8b6a83_0 conda-forge
ipython 8.18.0 pyh0d859eb_0 conda-forge
ipywidgets 8.0.4 py311h06a4308_0
jedi 0.19.1 pyhd8ed1ab_0 conda-forge
jinja2 3.1.2 pyhd8ed1ab_1 conda-forge
jmespath 1.0.1 pyhd8ed1ab_0 conda-forge
joblib 1.3.2 pyhd8ed1ab_0 conda-forge
json-c 0.17 h7ab15ed_0 conda-forge
jupyter_bokeh 3.0.7 py311h5eee18b_0
jupyter_client 8.6.0 pyhd8ed1ab_0 conda-forge
jupyter_core 5.5.0 py311h38be061_0 conda-forge
jupyterlab_widgets 3.0.9 py311h06a4308_0
kealib 1.5.2 hcd42e92_1 conda-forge
keyutils 1.6.1 h166bdaf_0 conda-forge
kiwisolver 1.4.5 py311h9547e67_1 conda-forge
krb5 1.21.2 h659d440_0 conda-forge
lcms2 2.15 h7f713cb_2 conda-forge
ld_impl_linux-64 2.38 h1181459_1
lerc 4.0.0 h27087fc_0 conda-forge
libaec 1.1.2 h59595ed_1 conda-forge
libarchive 3.7.2 h039dbb9_0 conda-forge
libblas 3.9.0 20_linux64_openblas conda-forge
libboost-headers 1.82.0 ha770c72_6 conda-forge
libbrotlicommon 1.1.0 hd590300_1 conda-forge
libbrotlidec 1.1.0 hd590300_1 conda-forge
libbrotlienc 1.1.0 hd590300_1 conda-forge
libcblas 3.9.0 20_linux64_openblas conda-forge
libcurl 8.4.0 hca28451_0 conda-forge
libdeflate 1.19 hd590300_0 conda-forge
libedit 3.1.20191231 he28a2e2_2 conda-forge
libev 4.33 h516909a_1 conda-forge
libexpat 2.5.0 hcb278e6_1 conda-forge
libffi 3.4.4 h6a678d5_0
libgcc-ng 13.2.0 h807b86a_3 conda-forge
libgdal 3.7.2 h6238fc3_5 conda-forge
libgfortran-ng 13.2.0 h69a702a_3 conda-forge
libgfortran5 13.2.0 ha4646dd_3 conda-forge
libglib 2.78.1 hebfc3b9_0 conda-forge
libgomp 13.2.0 h807b86a_3 conda-forge
libiconv 1.17 h166bdaf_0 conda-forge
libjpeg-turbo 2.1.5.1 hd590300_1 conda-forge
libkml 1.3.0 h01aab08_1018 conda-forge
liblapack 3.9.0 20_linux64_openblas conda-forge
libllvm14 14.0.6 hcd5def8_4 conda-forge
libnetcdf 4.9.2 nompi_h80fb2b6_112 conda-forge
libnghttp2 1.58.0 h47da74e_0 conda-forge
libnsl 2.0.1 hd590300_0 conda-forge
libopenblas 0.3.25 pthreads_h413a1c8_0 conda-forge
libpng 1.6.39 h753d276_0 conda-forge
libpq 16.1 hfc447b1_0 conda-forge
librttopo 1.1.0 hb58d41b_14 conda-forge
libsodium 1.0.18 h36c2ea0_1 conda-forge
libspatialindex 1.9.3 h9c3ff4c_4 conda-forge
libspatialite 5.1.0 h090f1da_1 conda-forge
libsqlite 3.44.0 h2797004_0 conda-forge
libssh2 1.11.0 h0841786_0 conda-forge
libstdcxx-ng 13.2.0 h7e041cc_3 conda-forge
libtiff 4.6.0 h29866fb_1 conda-forge
libuuid 2.38.1 h0b41bf4_0 conda-forge
libwebp-base 1.3.2 hd590300_0 conda-forge
libxcb 1.15 h0b41bf4_0 conda-forge
libxml2 2.11.6 h232c23b_0 conda-forge
libzip 1.10.1 h2629f0a_3 conda-forge
libzlib 1.2.13 hd590300_5 conda-forge
linkify-it-py 2.0.0 pyhd8ed1ab_0 conda-forge
llvmlite 0.41.1 py311ha6695c7_0 conda-forge
locket 1.0.0 pyhd8ed1ab_0 conda-forge
lz4-c 1.9.4 hcb278e6_0 conda-forge
lzo 2.10 h516909a_1000 conda-forge
mapclassify 2.6.1 pyhd8ed1ab_0 conda-forge
markdown 3.5.1 pyhd8ed1ab_0 conda-forge
markdown-it-py 3.0.0 pyhd8ed1ab_0 conda-forge
markupsafe 2.1.3 py311h459d7ec_1 conda-forge
matplotlib-base 3.8.0 py311h54ef318_1 conda-forge
matplotlib-inline 0.1.6 pyhd8ed1ab_0 conda-forge
mdit-py-plugins 0.4.0 pyhd8ed1ab_0 conda-forge
mdurl 0.1.0 pyhd8ed1ab_0 conda-forge
minizip 4.0.3 h0ab5242_0 conda-forge
multipledispatch 0.6.0 py_0 conda-forge
munch 4.0.0 pyhd8ed1ab_0 conda-forge
munkres 1.1.4 pyh9f0ad1d_0 conda-forge
ncurses 6.4 h6a678d5_0
nest-asyncio 1.5.8 pyhd8ed1ab_0 conda-forge
netcdf4 1.6.5 nompi_py311he8ad708_100 conda-forge
networkx 3.2.1 pyhd8ed1ab_0 conda-forge
nspr 4.35 h27087fc_0 conda-forge
nss 3.94 h1d7d5a4_0 conda-forge
numba 0.58.1 py311h96b013e_0 conda-forge
numpy 1.26.0 py311h64a7726_0 conda-forge
ocre-python-library 1.37.1 pypi_0 pypi
openjpeg 2.5.0 h488ebb8_3 conda-forge
openpyxl 3.0.10 py311h5eee18b_0
openssl 3.1.4 hd590300_0 conda-forge
packaging 23.2 pyhd8ed1ab_0 conda-forge
pandas 2.1.3 py311h320fe9a_0 conda-forge
panel 1.3.1 pyhd8ed1ab_0 conda-forge
param 2.0.1 pyhca7485f_0 conda-forge
parso 0.8.3 pyhd8ed1ab_0 conda-forge
partd 1.4.1 pyhd8ed1ab_0 conda-forge
pcre2 10.40 hc3806b6_0 conda-forge
pexpect 4.8.0 pyh1a96a4e_2 conda-forge
pickleshare 0.7.5 py_1003 conda-forge
pillow 10.0.1 py311h8aef010_1 conda-forge
pip 23.3 py311h06a4308_0
pixman 0.42.2 h59595ed_0 conda-forge
platformdirs 4.0.0 pyhd8ed1ab_0 conda-forge
plotly 5.18.0 pyhd8ed1ab_0 conda-forge
poppler 23.08.0 hf2349cb_2 conda-forge
poppler-data 0.4.12 hd8ed1ab_0 conda-forge
postgresql 16.1 h8972f4a_0 conda-forge
proj 9.3.0 h1d62c97_2 conda-forge
prompt-toolkit 3.0.41 pyha770c72_0 conda-forge
prompt_toolkit 3.0.41 hd8ed1ab_0 conda-forge
psutil 5.9.5 py311h459d7ec_1 conda-forge
psycopg2 2.9.7 py311h03dec38_1 conda-forge
pthread-stubs 0.4 h36c2ea0_1001 conda-forge
ptyprocess 0.7.0 pyhd3deb0d_0 conda-forge
pure_eval 0.2.2 pyhd8ed1ab_0 conda-forge
pyct 0.4.6 py_0 conda-forge
pyct-core 0.4.6 py_0 conda-forge
pygments 2.17.2 pyhd8ed1ab_0 conda-forge
pyparsing 3.1.1 pyhd8ed1ab_0 conda-forge
pypdf2 3.0.1 pypi_0 pypi
pyproj 3.6.1 py311h1facc83_4 conda-forge
pyqt5 5.15.10 pypi_0 pypi
pyqt5-qt5 5.15.2 pypi_0 pypi
pyqt5-sip 12.13.0 pypi_0 pypi
pyshp 2.3.1 pyhd8ed1ab_0 conda-forge
pyside2 5.13.2 pypi_0 pypi
pysocks 1.7.1 pyha2e5f31_6 conda-forge
python 3.11.5 hab00c5b_0_cpython conda-forge
python-dateutil 2.8.2 pyhd8ed1ab_0 conda-forge
python-tzdata 2023.3 pyhd8ed1ab_0 conda-forge
python_abi 3.11 4_cp311 conda-forge
pytz 2023.3.post1 pyhd8ed1ab_0 conda-forge
pyviz_comms 3.0.0 pyhd8ed1ab_0 conda-forge
pyyaml 6.0.1 py311h459d7ec_1 conda-forge
pyzmq 25.1.1 py311h34ded2d_2 conda-forge
readline 8.2 h5eee18b_0
requests 2.31.0 pyhd8ed1ab_0 conda-forge
rtree 1.1.0 py311h3bb2b0f_0 conda-forge
s3transfer 0.7.0 pyhd8ed1ab_0 conda-forge
scikit-learn 1.3.2 py311hc009520_1 conda-forge
scipy 1.11.3 py311h64a7726_1 conda-forge
setuptools 68.0.0 py311h06a4308_0
shapely 2.0.2 py311he06c224_0 conda-forge
shiboken2 5.13.2 pypi_0 pypi
six 1.16.0 pyh6c4a22f_0 conda-forge
snappy 1.1.10 h9fff704_0 conda-forge
sqlalchemy 2.0.23 py311h459d7ec_0 conda-forge
sqlite 3.41.2 h5eee18b_0
stack_data 0.6.2 pyhd8ed1ab_0 conda-forge
tenacity 8.2.3 pyhd8ed1ab_0 conda-forge
threadpoolctl 3.2.0 pyha21a80b_0 conda-forge
tiledb 2.16.3 hf0b6e87_3 conda-forge
tk 8.6.12 h1ccaba5_0
toolz 0.12.0 pyhd8ed1ab_0 conda-forge
tornado 6.3.3 py311h459d7ec_1 conda-forge
tqdm 4.66.1 pyhd8ed1ab_0 conda-forge
traitlets 5.13.0 pyhd8ed1ab_0 conda-forge
typing-extensions 4.8.0 hd8ed1ab_0 conda-forge
typing_extensions 4.8.0 pyha770c72_0 conda-forge
tzcode 2023c h0b41bf4_0 conda-forge
tzdata 2023c h04d1e81_0
uc-micro-py 1.0.1 pyhd8ed1ab_0 conda-forge
uriparser 0.9.7 hcb278e6_1 conda-forge
urllib3 1.26.18 pyhd8ed1ab_0 conda-forge
wcwidth 0.2.12 pyhd8ed1ab_0 conda-forge
webencodings 0.5.1 pyhd8ed1ab_2 conda-forge
wheel 0.41.2 py311h06a4308_0
widgetsnbextension 4.0.5 py311h06a4308_0
xarray 2023.11.0 pyhd8ed1ab_0 conda-forge
xerces-c 3.2.4 hac6953d_3 conda-forge
xlrd 2.0.1 pyhd8ed1ab_3 conda-forge
xorg-kbproto 1.0.7 h7f98852_1002 conda-forge
xorg-libice 1.1.1 hd590300_0 conda-forge
xorg-libsm 1.2.4 h7391055_0 conda-forge
xorg-libx11 1.8.7 h8ee46fc_0 conda-forge
xorg-libxau 1.0.11 hd590300_0 conda-forge
xorg-libxdmcp 1.1.3 h7f98852_0 conda-forge
xorg-libxext 1.3.4 h0b41bf4_2 conda-forge
xorg-libxrender 0.9.11 hd590300_0 conda-forge
xorg-renderproto 0.11.1 h7f98852_1002 conda-forge
xorg-xextproto 7.3.0 h0b41bf4_1003 conda-forge
xorg-xproto 7.0.31 h7f98852_1007 conda-forge
xyzservices 2023.10.1 pyhd8ed1ab_0 conda-forge
xz 5.4.2 h5eee18b_0
yaml 0.2.5 h7f98852_2 conda-forge
zeromq 4.3.5 h59595ed_0 conda-forge
zipp 3.17.0 pyhd8ed1ab_0 conda-forge
zlib 1.2.13 hd590300_5 conda-forge
zstd 1.5.5 hfc55251_0 conda-forge
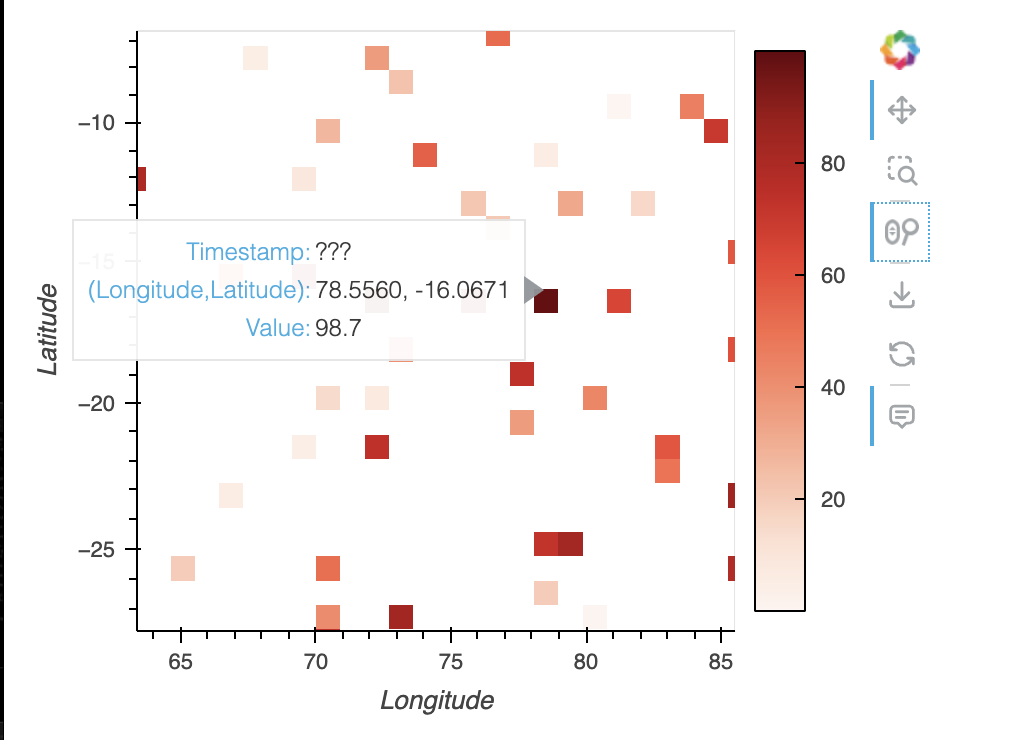
#### Description of expected behavior and the observed behavior
When hover tooltip is enabled, Timestamp not working. I discussed this issue in discourse, Andrew helped me to fix some things, still Timestamp is not working.
https://discourse.holoviz.org/t/how-to-set-up-hovertool-for-multiple-columns-with-hvplot/4294/16?u=balsher.singh
#### Complete, minimal, self-contained example code that reproduces the issue
```
import pandas as pd
import hvplot.pandas
import numpy as np
from bokeh.models import HoverTool, CustomJSHover
import holoviews as hv
import hvplot
import panel as pn
import geoviews as gv
gv.extension('bokeh')
# Create a dummy DataFrame
np.random.seed(0)
n = 10000 # number of points
df = pd.DataFrame({
'Longitude': np.random.uniform(-180, 180, n),
'Latitude': np.random.uniform(-90, 90, n),
'Timestamp': pd.date_range(start='2023-01-01', periods=n, freq='D'),
'Value': np.random.rand(n) * 100 # This will represent 'selected_col'
})
selected_col = 'Value'
tile = hv.element.tiles.EsriNatGeo().opts(width=1000, height=650)
_hover_code = """
const projections = Bokeh.require("core/util/projections");
const {snap_x, snap_y} = special_vars
const coords = projections.wgs84_mercator.invert(snap_x, snap_y)
return "" + (coords[%d]).toFixed(4)
"""
hover = HoverTool(
tooltips=[
("Timestamp", "@Timestamp"),
("(Longitude,Latitude)", "$x{custom}, $y{custom}"),
(selected_col, f"@image{{0.0}}"),
],
formatters={
"$x": CustomJSHover(code=_hover_code % 0),
"$y": CustomJSHover(code=_hover_code % 1),
},
)
plot = df.hvplot.points(
'Longitude', 'Latitude',
geo=True,
tiles=tile,
tools=[hover],
c=selected_col,
cmap='Reds',
colorbar=True,
rasterize=True,
dynamic=False,
)
hvplot.show(plot)
```
#### Stack traceback and/or browser JavaScript console output
[bokeh] setting log level to: 'info'
bokeh.min.js?v=76cb725c10c0dc0fcfcd57552964929a1997934b09c9392795906e419823fd85132cff7725188cf3205f1bed65127750d10bd13fc527cb2f80a50f24b45a369f:226 [bokeh] Websocket connection 0 is now open
bokeh.min.js?v=76cb725c10c0dc0fcfcd57552964929a1997934b09c9392795906e419823fd85132cff7725188cf3205f1bed65127750d10bd13fc527cb2f80a50f24b45a369f:163 Bokeh items were rendered successfully
bokeh.min.js?v=76cb725c10c0dc0fcfcd57552964929a1997934b09c9392795906e419823fd85132cff7725188cf3205f1bed65127750d10bd13fc527cb2f80a50f24b45a369f:165 [bokeh] document idle at 537 ms
#### Screenshots or screencasts of the bug in action