Hi, I’m facing the same issue. Below is the minimal reproducible example.
import pandas as pd
import hvplot.pandas
import numpy as np
from bokeh.models import HoverTool
import holoviews as hv
import hvplot
import panel as pn
import geoviews as gv
gv.extension('bokeh')

# Create a dummy DataFrame
np.random.seed(0)
n = 10000  # number of points
df = pd.DataFrame({
    'Longitude': np.random.uniform(-180, 180, n),
    'Latitude': np.random.uniform(-90, 90, n),
    'Timestamp': pd.date_range(start='2023-01-01', periods=n, freq='D'),
    'Value': np.random.rand(n) * 100  # This will represent 'selected_col'
})


selected_col = 'Value'
tile = hv.element.tiles.EsriNatGeo().opts(width=1000, height=650)
hover = HoverTool(tooltips=[
                            ("Timestamp","@Timestamp"),
                            ("(Longitude,Latitude)", "@Longitude, @Latitude"),
                            (selected_col,f"@{{selected_col}}{{0.0}}")
                        ], formatters={"@{Timestamp}": "datetime"})
plot = df.hvplot.points(
    'Longitude', 'Latitude',
    geo=True,
    tiles=tile,
    tools=[hover],
    c=selected_col,
    cmap='Reds',
    colorbar=True,
    rasterize=True,
    dynamic=False,
)
hvplot.show(plot)
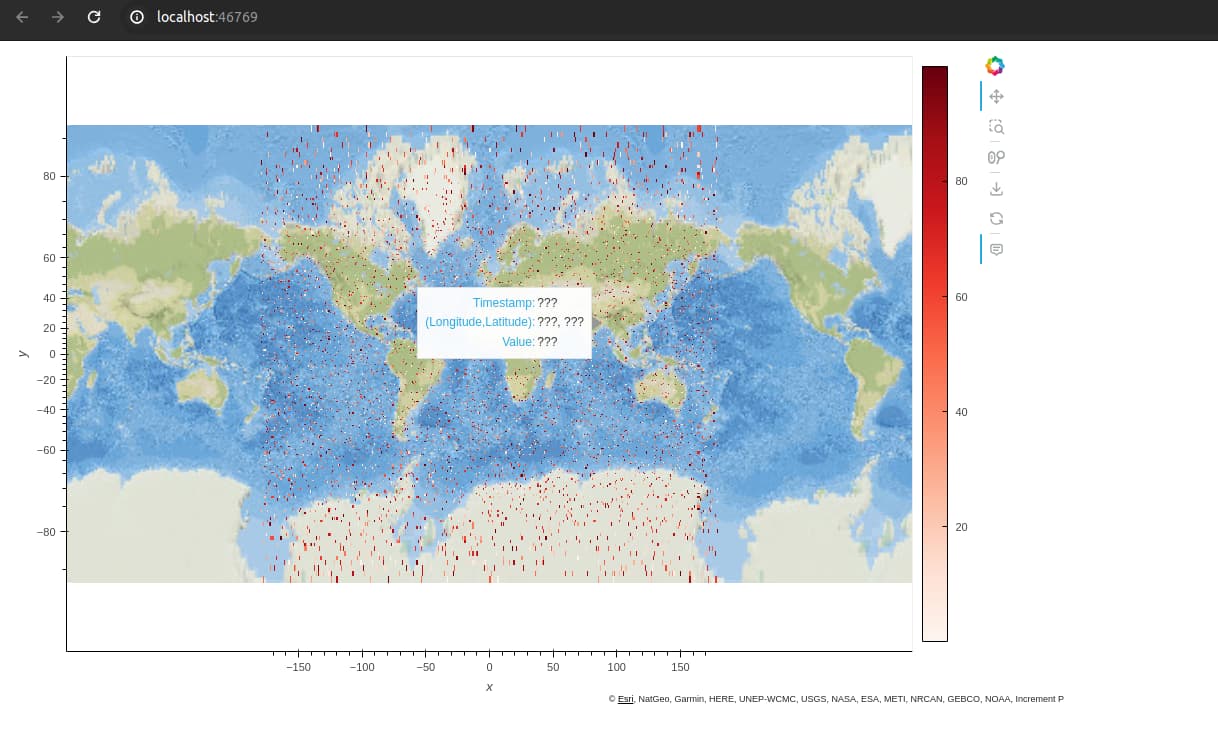
How to make hover cols work?
I have been struggling with this for days now. Please help!