The index “Month-Day” is a type of String indicating the first day and the last day of a calendar year (from 1st of July to the 30th of June of the next year) instead of type of datetime.
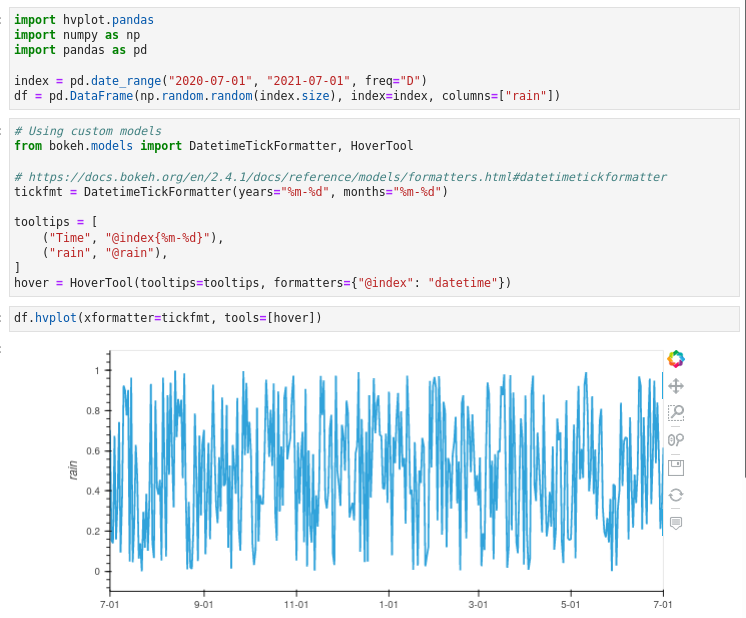
I need to use hvPlot to develop an interactive plot. I tried the following code:
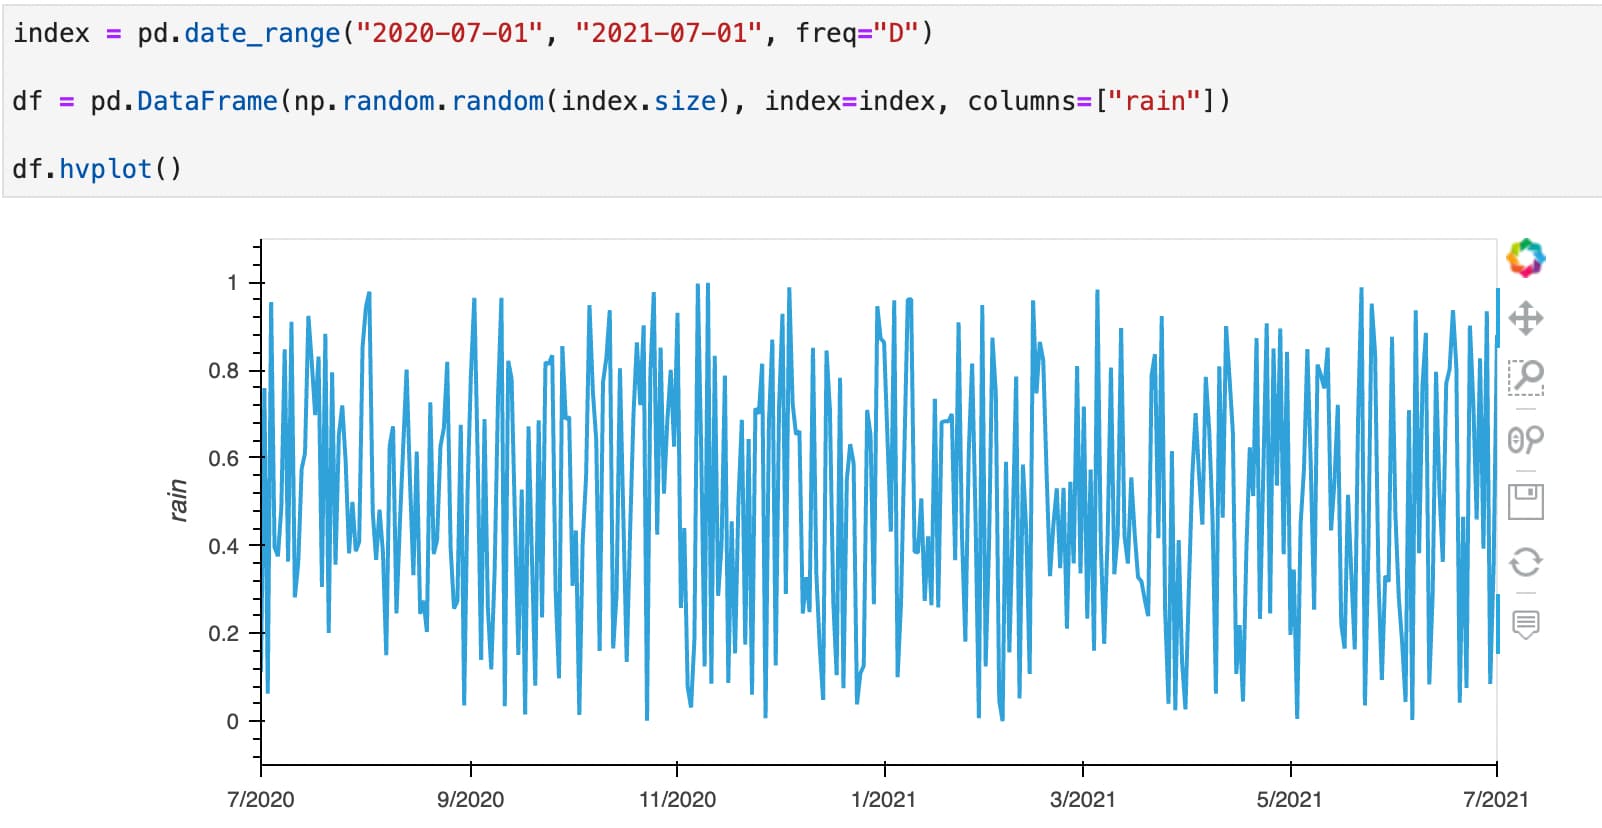
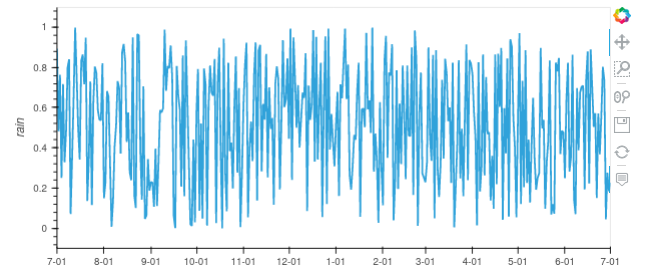
Just wanted to add that if you turn your date index into a real date type, hvplot will automatically make the xaxis look nice without anything further needed (I’m not sure how important it is for @achen to have the xtick actually just ‘M-D’ format or not).
Your code worked pretty well. I have slightly made some changes.
# DEAL WITH DATE
region_cumulative_df_sel['Month-Day-2'] = pd.to_datetime( Region_cumulative_df_sel['Month-Day'],format="%m-%d")  ##Convert to datetime

# ADD ONE YEAR TO THE ARBITRARY YEAR IF DATE IS BETWEEN 01-Jan and 30-June FOR PLOTTING
region_cumulative_df_sel['Month-Day-3'] = np.where(pd.DatetimeIndex(region_cumulative_df_sel['Month-Day-2']).month < 7, region_cumulative_df_sel['Month-Day-2'] + pd.DateOffset(years=1), region_cumulative_df_sel['Month-Day-2'])

# Remove old String-type "Month-Day" and "Month-Day-2"
region_cumulative_df_sel= region_cumulative_df_sel.drop(columns=['Month-Day', 'Month-Day-2'])

# STACK AND RESHAPE THE COLUMNS AND ROWS
df_csv_concat_stack = (region_cumulative_df_sel.set_index(["Month-Day-3", "regions"])
         .stack()
         .reset_index(name='Rainfall')
         .rename(columns={'level_2':'Variable'}))
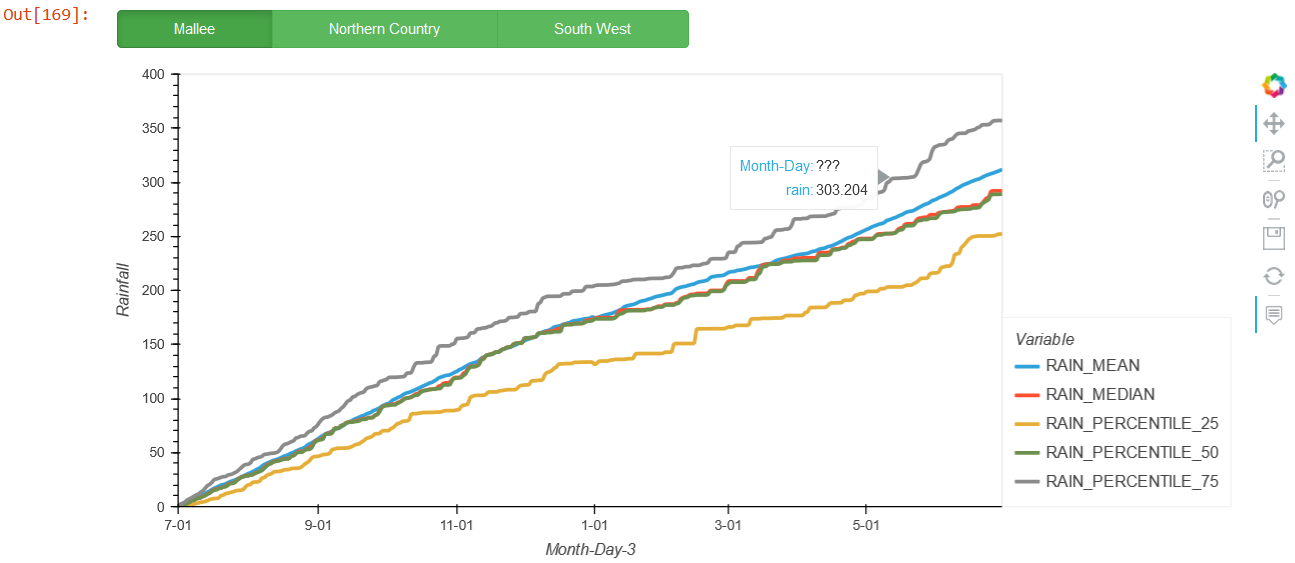
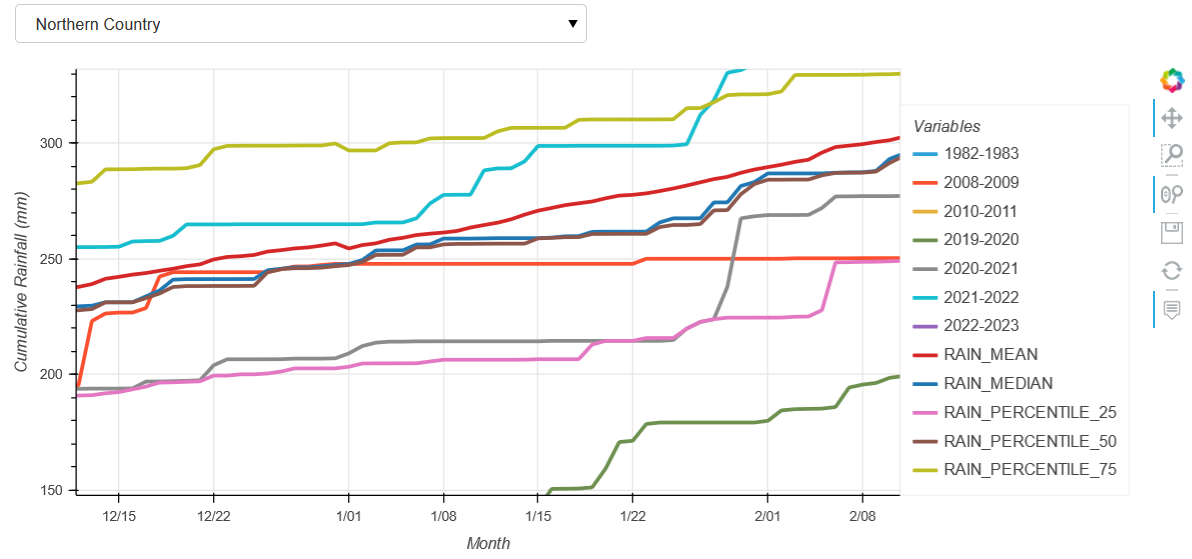
The interactive plotting was generated pretty well except for the tooltips on hover. The “Month-Day” displayed “???”. How can I fix it?
Also the xticks show every other month e.g. “7-01” “9-01” … … “5-01” (M-D). How can I show every single month instead e.g. “7-01” “8-01” … … “6-01” (M-D)?
Thanks @droumis .
Yes it is very important to have xtick show actually the “M-D” format, so I need to remove the “Y” component and also show the “M-D” format in the tooltips on mouse hover as well.
The interactive plotting was generated pretty well except for the tooltips on hover. The “Month-Day” displayed “???”. How can I fix it?
You should rename @index to the column name like this @Month-Day-3 (or whatever it is). Both in tooltips and formatters.
Also the xticks show every other month e.g. “7-01” “9-01” … … “5-01” (M-D). How can I show every single month instead e.g. “7-01” “8-01” … … “6-01” (M-D)?
This could be done with MonthTicker, though it would be fixed to the month and not updating when zooming in.