How to show a QQ-plot?

I want to show a QQ-plot in a Holoviz panel. Normally I would create a QQ-plot as shown below:

import statsmodels.api as sm
sm.qqplot(df.cost, fit=True, line ='45', dist=stats.invgauss);

However, no matter what I do I can not get the resulting figure to show in a Holoviz panel. How do I get the QQ-plot to show?

1 Like

Hi @randomBloke

Could you provide a minimum, reproducible example? That would make the investigation much easier? Thanks.

Here is a small code example in which random data is produced and plotted:

import statsmodels.api as sm
import numpy as np

data = np.random.normal(0, 1, 100)    
sm.qqplot(data, line ='45');

This produces the output:
afbeelding

Hi. Panel needs to receive a Matplotlib Figure object. C.f. Matplotlib β€” Panel.

Very often functions that plot via Matplotlib accept an ax argument where you can then provide the Matplotlib Axes object to plot on. You can create the Axes from the Figure object as shown below.

import statsmodels.api as sm
import numpy as np
from matplotlib.figure import Figure
from matplotlib import cm


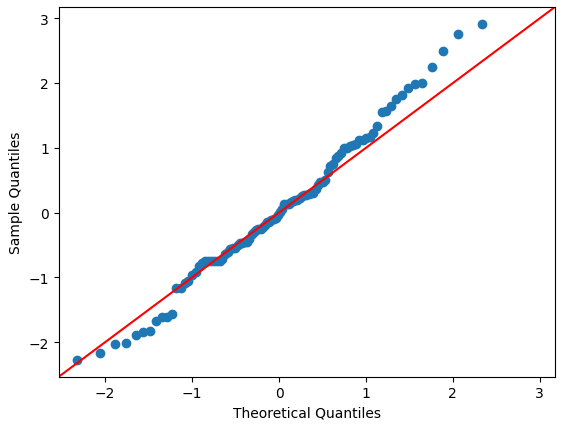
def qqplot(data, line):
    fig = Figure(figsize=(8, 6))
    ax = fig.subplots()
    sm.qqplot(data, line=line, ax=ax)

    return fig


data = np.random.normal(0, 1, 100)

import panel as pn

pn.extension(sizing_mode="stretch_width", design="bootstrap")
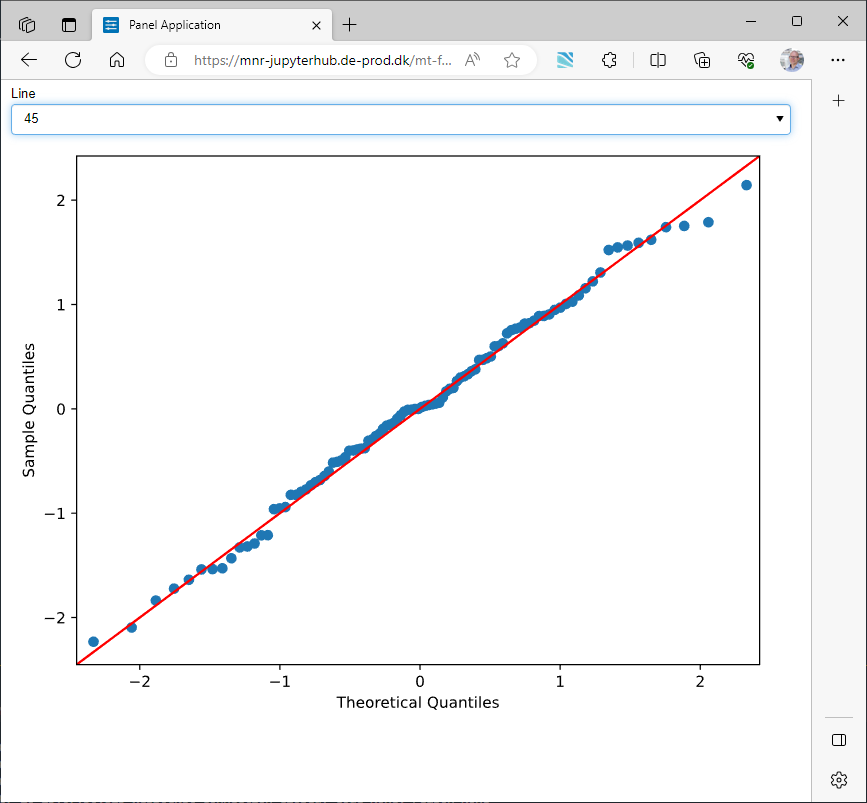
line = pn.widgets.Select(name="Line", value="45", options=["45", "s", "r", "q", None])

plot = pn.bind(qqplot, line=line, data=data)

pn.Column(
    line,
    pn.pane.Matplotlib(plot, tight=True, format="svg"),
    max_width=800,
).servable()

1 Like

Thank you so much! I was wondering if it would be possible to bind the argument dist from sm.qqplot(..., dist=...) to a button?

1 Like

I don’t understand what you mean by button.

But with the help of Param and Panel you can make the qqplot interactive. Including the dist parameter.

import statsmodels.api as sm
import numpy as np
from matplotlib.figure import Figure

from param import Parameterized
import param
import scipy.stats as stats


class QQPlot(Parameterized):
    """Function to draw qqplot"""

    data = param.Parameter(precedence=-1)
    line = param.Selector(objects=["45", "s", "r", "q", None])
    dist = param.Selector(objects={"None": None, "T-distribution": stats.t})
    distargs = param.Tuple(default=(1,))

    def fig(self):
        _fig = Figure(figsize=(8, 6))
        ax = _fig.subplots()

        if self.dist:
            sm.qqplot(
                data=self.data,
                line=self.line,
                dist=self.dist,
                distargs=self.distargs,
                ax=ax,
            )
        else:
            sm.qqplot(data=self.data, line=self.line, ax=ax)
        return _fig

    @param.depends("dist", watch=True)
    def _hide_distargs(self):
        if self.dist:
            self.param.distargs.precedence = None
        else:
            self.param.distargs.precedence = -1


data = np.random.normal(0, 1, 100)

plot = QQPlot(data=data, dist=stats.t, distargs=(4,))

import panel as pn

pn.extension(sizing_mode="stretch_width", design="bootstrap")

pn.Row(
    pn.WidgetBox(plot, sizing_mode="fixed", width=300), 
    pn.panel(plot.fig, tight=True),
    margin=25,
).servable()

Do you have any idea why the toggles do not have an effect in the code below:

def qqplot(data, distribution):
    fig = Figure(figsize=(8, 6))
    ax = fig.subplots()
    sm.qqplot(data,  fit=True, line ='45', dist=distribution, ax=ax)
    return fig

toggles = pn.widgets.ToggleGroup(
    name="Select distribution",
    options=["Inverse Gaussian", "Normal", "Binomial", "Gamma"],
    behavior="radio",
    value="Normal",
)    

distributions = pd.Series([stats.invgauss, stats.norm, stats.binom, stats.gamma], 
                           index=["Inverse Gaussian", "Normal", "Binomial", "Gamma"])
fig_QQ = pn.bind(qqplot, data=df.income, distribution=distributions[toggles.value])

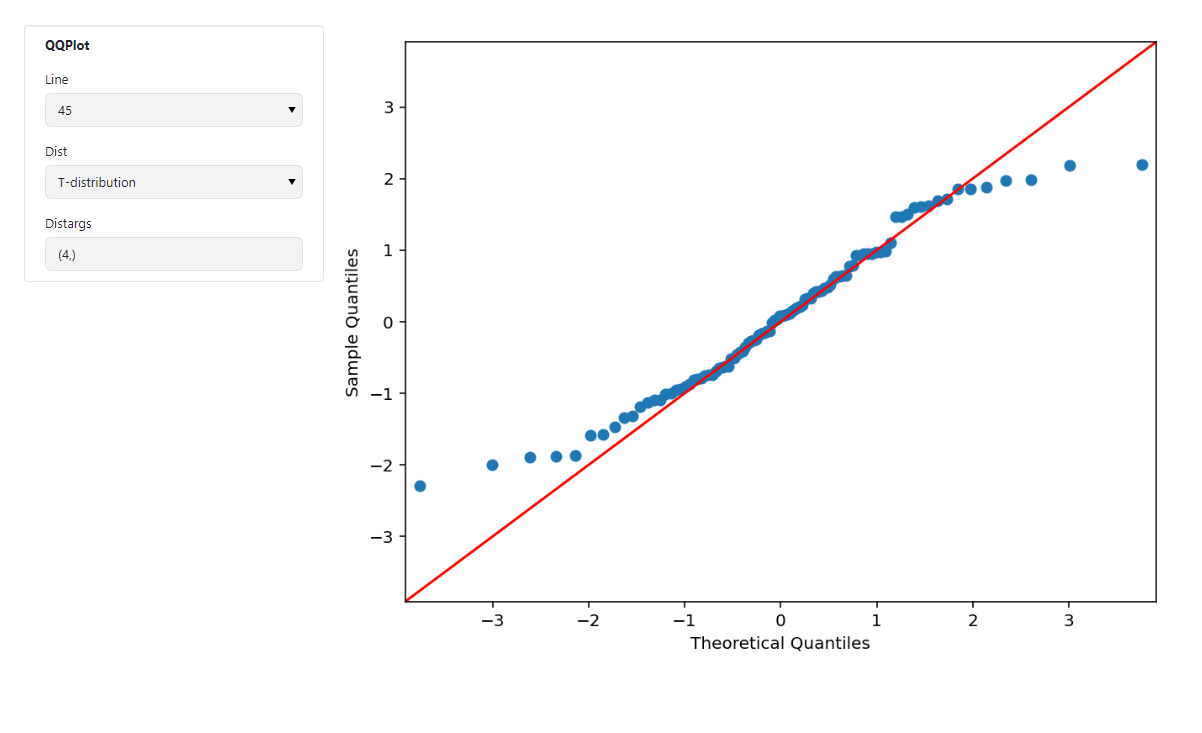
The plot does not react to changes in the toggles. I get the following warning as well:

WARNING:param.ParamFunction01034: The function 'qqplot' does not have any dependencies and will      never update. Are you sure you did not intend to depend on or bind a parameter or widget to this function? If not simply call the function before passing it to Panel. Otherwise, when passing a parameter as an argument, ensure you pass at least one parameter and reference the actual parameter object not the current value, i.e. use object.param.parameter not object.parameter

Yes. Its the line distributions=distributions[toggles.value] that does not make sense.

Try reorganizing to

def qqplot(data, distribution_name):
    distribution = distributions[distribution_name]
    fig = Figure(figsize=(8, 6))
    ax = fig.subplots()
    sm.qqplot(data,  fit=True, line ='45', dist=distribution, ax=ax)
    return fig

toggles = pn.widgets.ToggleGroup(
    name="Select distribution",
    options=["Inverse Gaussian", "Normal", "Binomial", "Gamma"],
    behavior="radio",
    value="Normal",
)    

distributions = pd.Series([stats.invgauss, stats.norm, stats.binom, stats.gamma], 
                           index=["Inverse Gaussian", "Normal", "Binomial", "Gamma"])
fig_QQ = pn.bind(qqplot, data=df.income, distribution_name=toggles)
1 Like