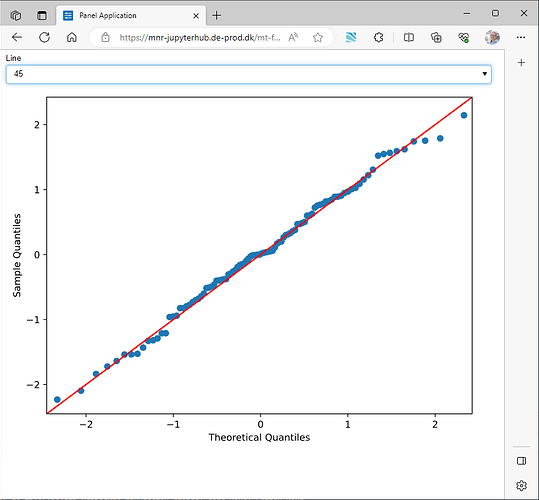
Hi. Panel needs to receive a Matplotlib Figure object. C.f. Matplotlib — Panel.
Very often functions that plot via Matplotlib accept an ax argument where you can then provide the Matplotlib Axes object to plot on. You can create the Axes from the Figure object as shown below.
import statsmodels.api as sm
import numpy as np
from matplotlib.figure import Figure
from matplotlib import cm


def qqplot(data, line):
    fig = Figure(figsize=(8, 6))
    ax = fig.subplots()
    sm.qqplot(data, line=line, ax=ax)

    return fig


data = np.random.normal(0, 1, 100)

import panel as pn

pn.extension(sizing_mode="stretch_width", design="bootstrap")
line = pn.widgets.Select(name="Line", value="45", options=["45", "s", "r", "q", None])

plot = pn.bind(qqplot, line=line, data=data)

pn.Column(
    line,
    pn.pane.Matplotlib(plot, tight=True, format="svg"),
    max_width=800,
).servable()
