How to specify widget type for DynamicMap?

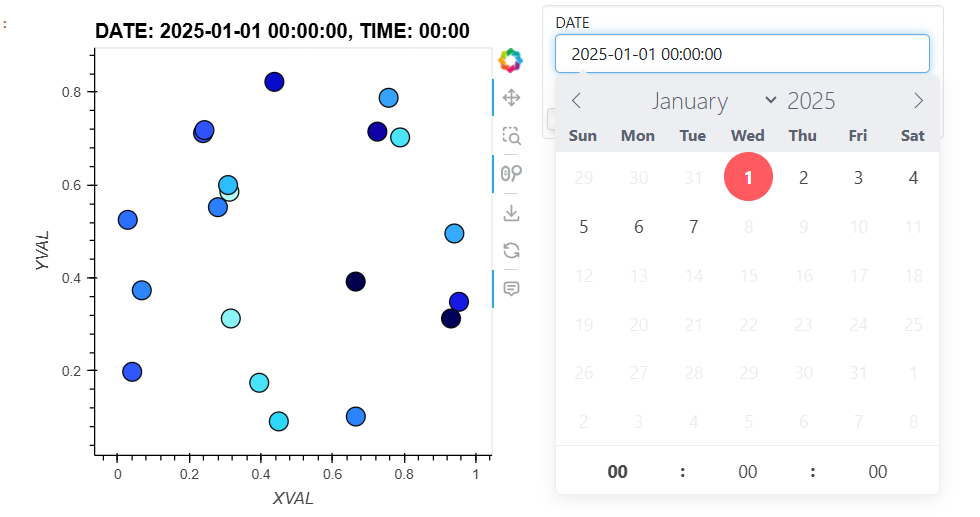
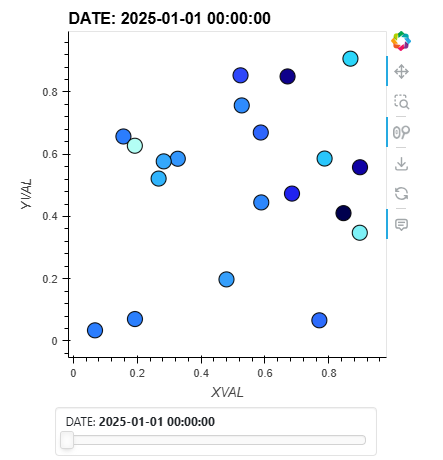
Is there a straightforward way to specify the type of widget that is associated with a hv.DynamicMap or hv.HoloMap? In some cases the widget is a slider, like the image below, and in other cases the widget is a dropdown, but it is not clear to my why one or the other is chosen.

For example is it possible to pass an argument to hv.DynamicMap, or perhaps could I go through panel and access the pn.pane.HoloViews(dmap).widget object?

Image created using the Minimum Example, below:
image

Minimum Example

Minimum Example

# =========================================
# Imports
# =========================================
import numpy as np
import pandas as pd
import holoviews as hv

from functools import partial

hv.extension("bokeh")
hv.output(widget_location='bottom')

def prep_data():
    """Generate pseudo data representing in-situ measurements on different dates"""

    t = pd.date_range("2025-01-01","2025-01-07")
        
    pts = np.random.random(size=(20,2))
    
    data_rows = []
    
    for t0 in t:
        for p0 in pts:
    
            x0, y0 = p0
            
            z0 = ((x0 ** 2) + np.sin(y0)) *  np.random.randn()
    
            data_rows.append([t0,x0,y0,z0])
    
    table = hv.Table(
        data = pd.DataFrame(data_rows,columns=['DATE','XVAL','YVAL','ZVAL']),
        kdims=['DATE'],
    )

    return table

def scatter_dmap(date,table):
    """Callback for DynamicMap to display measurements on a specific date"""

    table_subset = table[table['DATE']==date]

    scatter = hv.Points(
        table_subset,
        kdims=['XVAL','YVAL']
    ).opts(
        size = 15,
        color = 'ZVAL',
        line_color = 'k',
        tools=['hover'],
        width=400,
        height=400
    )

    return scatter

# =========================================
# Make the DynamicMap
# =========================================

table = prep_data()
scatter_dmap = partial(scatter_dmap,table=table)

dmap = hv.DynamicMap(scatter_dmap,kdims=['DATE'])
dmap = dmap.redim.values(**{'DATE':np.unique(table['DATE'])})

dmap

Normally, a slider is used for a numerical dimension, and a dropdown is used for a categorical dimension. You should be able to change the slider type using Panel, but I don’t have the syntax handy.

1 Like

Here’s a minimum solution to explicitly specify the widget types using panel based on the suggestion from @jbednar

Minimum Solution

# =========================================
# Imports
# =========================================
import numpy as np
import pandas as pd
import holoviews as hv
import panel as pn
from functools import partial

hv.extension("bokeh")
hv.output(widget_location='bottom')

def prep_data():
    """Generate pseudo data representing in-situ measurements on different dates"""

    d = pd.date_range("2025-01-01","2025-01-07")
    t = [f"{x:>02}:00" for x in range(24)]
    
    pts = np.random.random(size=(20,2))
    
    data_rows = []

    z0 = 0
    for d0 in d:
        for t0 in t:
            for p0 in pts:
        
                x0, y0 = p0
                
                z0 = z0 + (((x0 ** 2) + np.sin(y0)) *  np.random.randn())
        
                data_rows.append([d0,t0,x0,y0,z0])
    
    table = hv.Table(
        data = pd.DataFrame(data_rows,columns=['DATE','TIME','XVAL','YVAL','ZVAL']),
        kdims=['DATE','TIME'],
    )

    return table

def scatter_dmap(date,time,table):
    """Callback for DynamicMap to display measurements on a specific date and time"""

    table_subset = table[table['DATE']==date]
    table_subset = table_subset[table_subset['TIME']==time]

    scatter = hv.Points(
        table_subset,
        kdims=['XVAL','YVAL']
    ).opts(
        size = 15,
        color = 'ZVAL',
        line_color = 'k',
        tools=['hover'],
        width=400,
        height=400
    )

    return scatter

# =========================================
# Make the DynamicMap
# =========================================
table = prep_data()
scatter_dmap = partial(scatter_dmap,table=table)

dmap = hv.DynamicMap(scatter_dmap,kdims=['DATE','TIME'])
dmap = dmap.redim.values(
    **{'DATE':np.unique(table['DATE']),'TIME':np.unique(table['TIME'])}
)

# =========================================
# !!! SPECIFY WIDGETS EXPLICITLY !!!
# =========================================
pane = pn.pane.HoloViews(dmap,widgets={
    'TIME':pn.widgets.DiscreteSlider,
    'DATE':pn.widgets.DatetimePicker
})