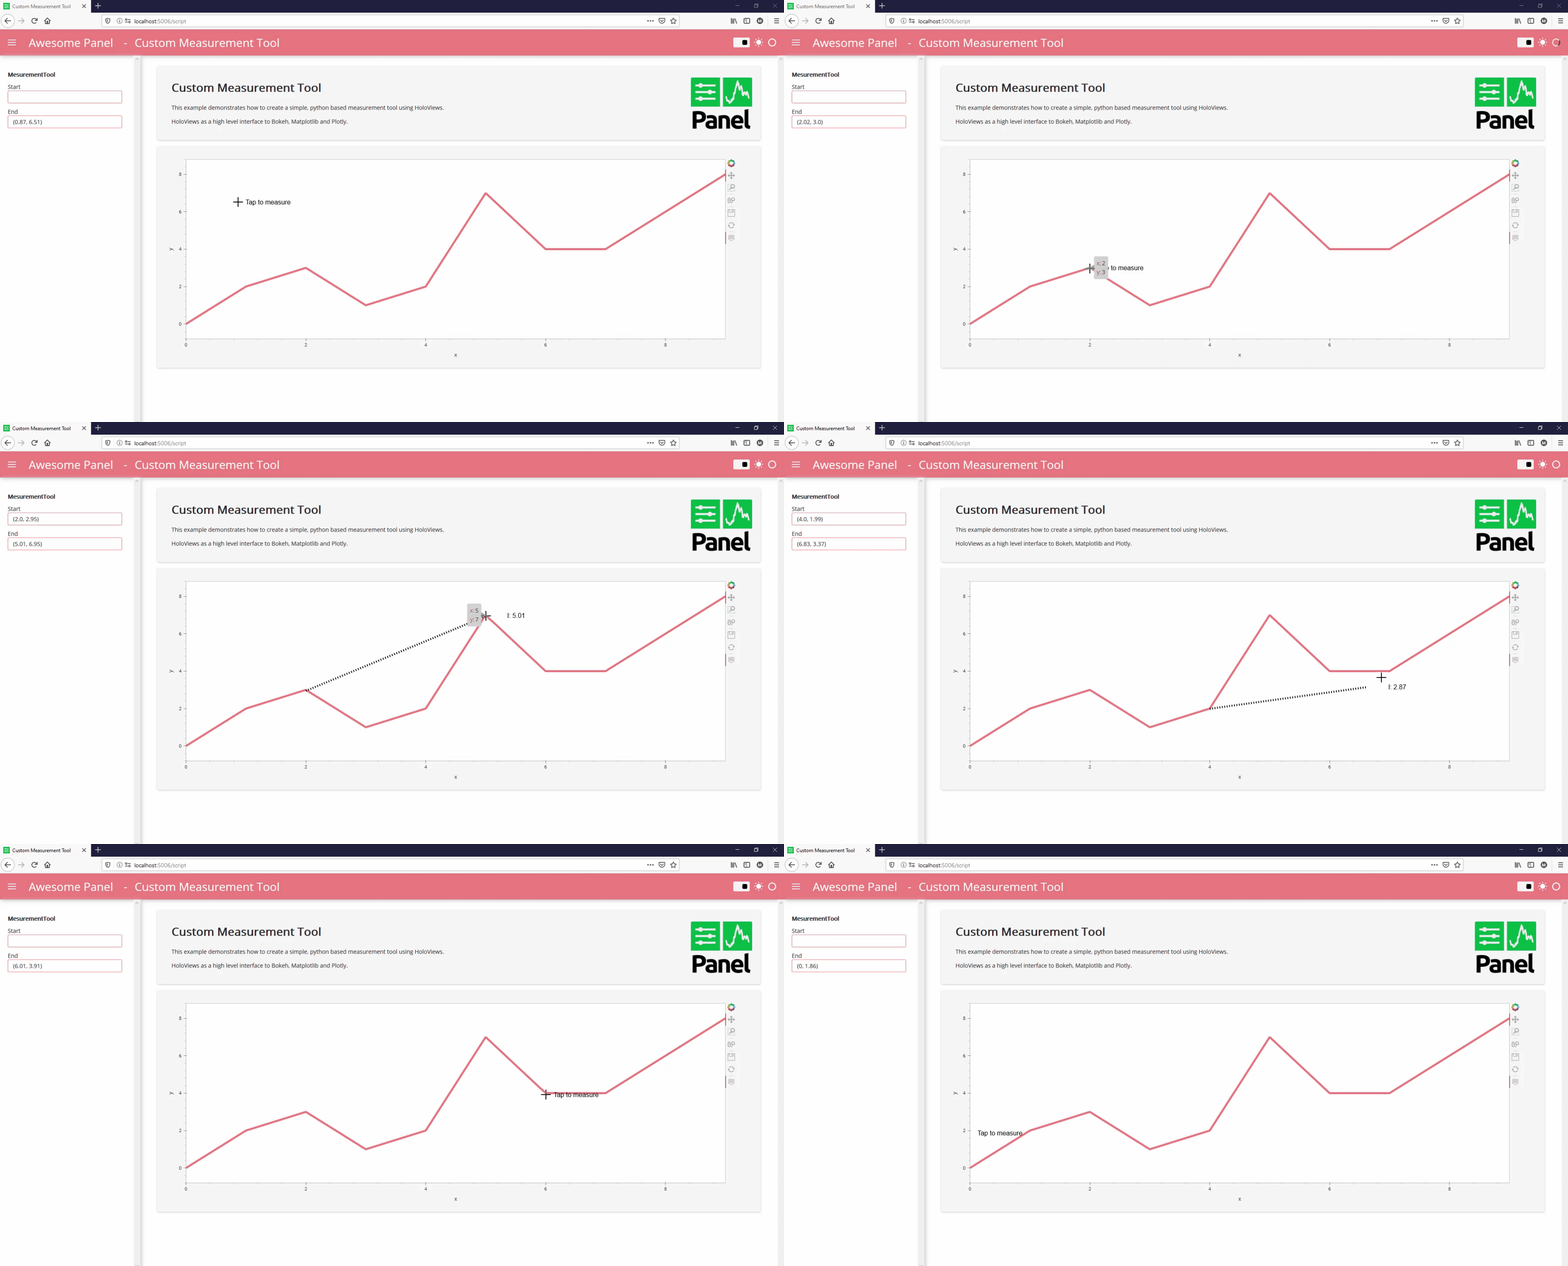
I’ve tried to create a python based solution based on Streams/ Events.
The basic idea was to use Tap and PointerXY to capture the inputs for the measurement_plot. The measurement_plot it self is a Dynamicmap . This plot is then overlaid to the base_plot. The base_plot could be your datashaded plot or any other plot.
Two problems probably still have to be solved.
- When adding the measurement plot I can no longer pan.
- I cannot get the whole plot to be responsive instead of fixed size.
You can serve the example via panel serve name_of_script.py --autoreload.
import holoviews as hv
from holoviews.core import data
import panel as pn
import pandas as pd
import hvplot.pandas
import param
import math

pn.extension()
hv.extension("bokeh", sizing_mode="stretch_width")
from holoviews import streams

accent_base_color = "#F08080"
line_color = "black"

def get_line_plot(start, end):
    if start and end:
        line = [(start), (end)]
    else:
        line = []
    return (
        hv.Curve(line)
        .opts(line_width=5, line_dash="dotted", color=line_color)
    )

def get_length(start,end):
    if start and end:
        start_x, start_y = start
        end_x, end_y = end
        return round(math.sqrt((end_x-start_x)**2+(end_y-start_y)**2),2)
    return 0

def get_hover_plot(start, end):
    if not start and end:
        text = "Tap to measure"
    elif not end:
        text = ""
    else:
        length = get_length(start,end)
        text=f"""l: {length}"""
    if not end:
        end=(0,0)
    else:
        end=(end[0]+0.5, end[1])
    return hv.Text(*end, text)

def get_measurement_plot(start, end):
    return get_line_plot(start, end)*get_hover_plot(start, end)

class MeasurementTool(param.Parameterized):
    start = param.Tuple(default=None, length=2, allow_None=True)
    end = param.Tuple(default=None, length=2, allow_None=True)

    plot = param.Parameter(precedence=-1)
    source = param.Parameter(constant=True, precedence=-1)


    def __init__(self, **params):
        super().__init__(**params)

        hover = streams.PointerXY(x=0, y=0, source=base_plot)
        tap = streams.Tap(source=self.source)

        pn.bind(self._set_end, x=hover.param.x, y=hover.param.y, watch=True)
        pn.bind(self._set_start, x=tap.param.x, y=tap.param.y, watch=True)

        self.plot = hv.DynamicMap(get_measurement_plot, streams=[self.param.start, self.param.end]).opts(responsive=True)

    def _set_start(self, x, y):
        if self.start:
            self.start=None
        else:
            self.start = (round(x,2),round(y,2))

    def _set_end(self, x,y):
        self.end=(round(x,2),round(y,2))


data = pd.DataFrame({
    "x": list(range(0,10)),
    "y": [0,2,3,1,2,7,4,4,6,8],
})


base_plot = data.hvplot(x="x", y="y", kind="line").opts(color=accent_base_color, line_width=5, width=1400, height=500)
measurement_tool = MeasurementTool(source=base_plot)
measurement_plot = measurement_tool.plot

plot = base_plot * measurement_plot

description = pn.pane.Markdown("""# Custom Measurement Tool

This example demonstrates how to create a simple, python based measurement tool using HoloViews.

HoloViews as a high level interface to Bokeh, Matplotlib and Plotly.
""", sizing_mode="stretch_width")
panel_logo_url = "https://panel.holoviz.org/_static/logo_stacked.png"
panel_logo = pn.pane.PNG(panel_logo_url, link_url="https://panel.holoviz.org", embed=False, width=150, sizing_mode="fixed", align="center")


pn.template.FastListTemplate(
    site="Awesome Panel",
    title="Custom Measurement Tool",
    sidebar=[pn.Param(measurement_tool)],
    main=[
        pn.Row(description, panel_logo),
        plot,
    ],
    accent_base_color=accent_base_color,
    header_background=accent_base_color,
    header_accent_base_color="white",
).servable()
