How to turn off plot lines for certain values when plotting?

Hello. I am trying to create a spectrum plot for some data which has values that were not measured by the equipment. These values show up as 0 on the plot, but I was wondering if there is a way to remove them altogether, while still maintaining the spacing between the parts that do have values. Thank you in advance.

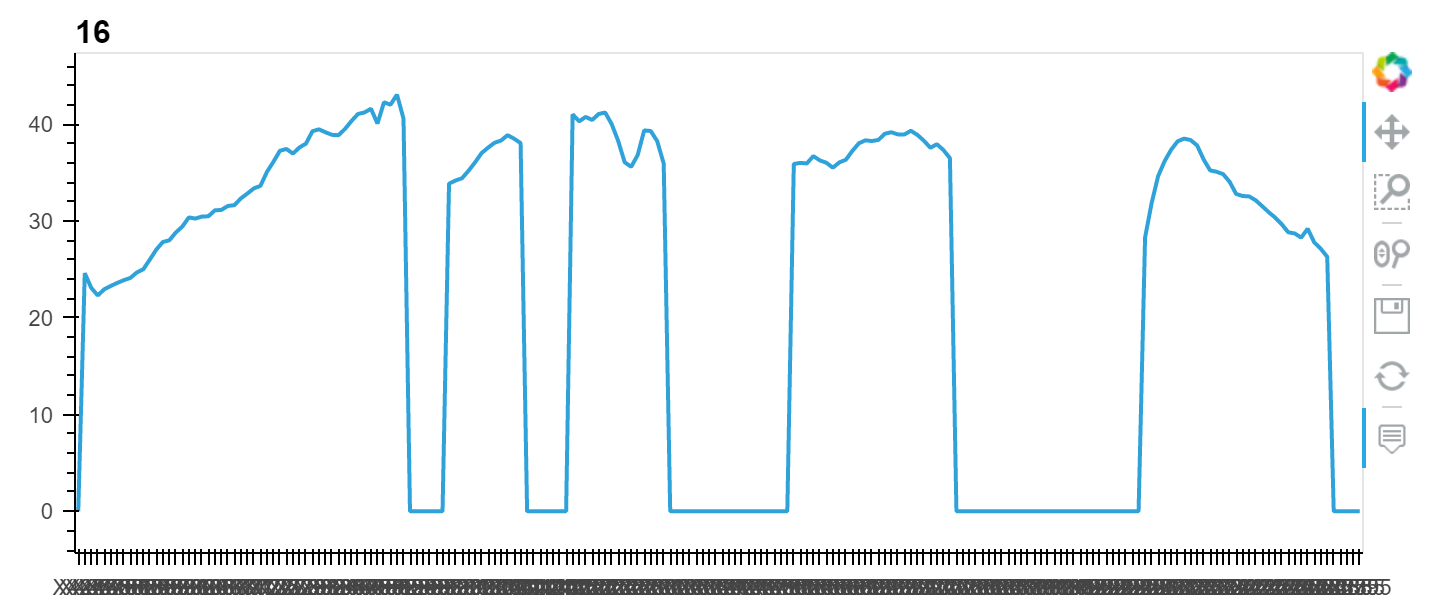
Basically, I want the parts that are at value 0 to not be drawn.

You could try simply replacing them with NaNs. Also it looks like your x-axis values are strings, you will probably want to convert them to floats or dates (can’t make out which).

Thank you for this! Worked like a charm. The x-axis values are numbers that have ‘X’ in front, I will definitely convert them into numbers!

1 Like