I want to plot two time series of different amplitudes and shade parts of the plot (using holoviews.VSpan). How to I compose the line plots and the VSpan to not mess up axes but still keeping the shading in the background?
Setup and example data
import pandas as pd
import numpy as np
import hvplot.pandas
import holoviews as hv

time = pd.date_range("2020-01-01", "2020-12-31")
data_o1 = 1.0 * np.random.normal(size=(len(time, )))
data_o10 = 10.0 * np.random.normal(size=(len(time, )))

df = pd.DataFrame(dict(time=time, data_o1=data_o1, data_o10=data_o10))
df = df.set_index("time")
VSpan * uses wider limits for both
time_span = hv.VSpan(np.datetime64("2020-07-01"), np.datetime64("2020-09-30"))

time_span * (
    df.hvplot.line(y="data_o1", width=300) + df.hvplot.line(y="data_o10", width=300)
)
No image as I’m a new user and cannot post more than one.
* VSpan keeps adjusted limits
(
    df.hvplot.line(y="data_o1", width=300) + df.hvplot.line(y="data_o10", width=300)
) * time_span
almost gets us there:
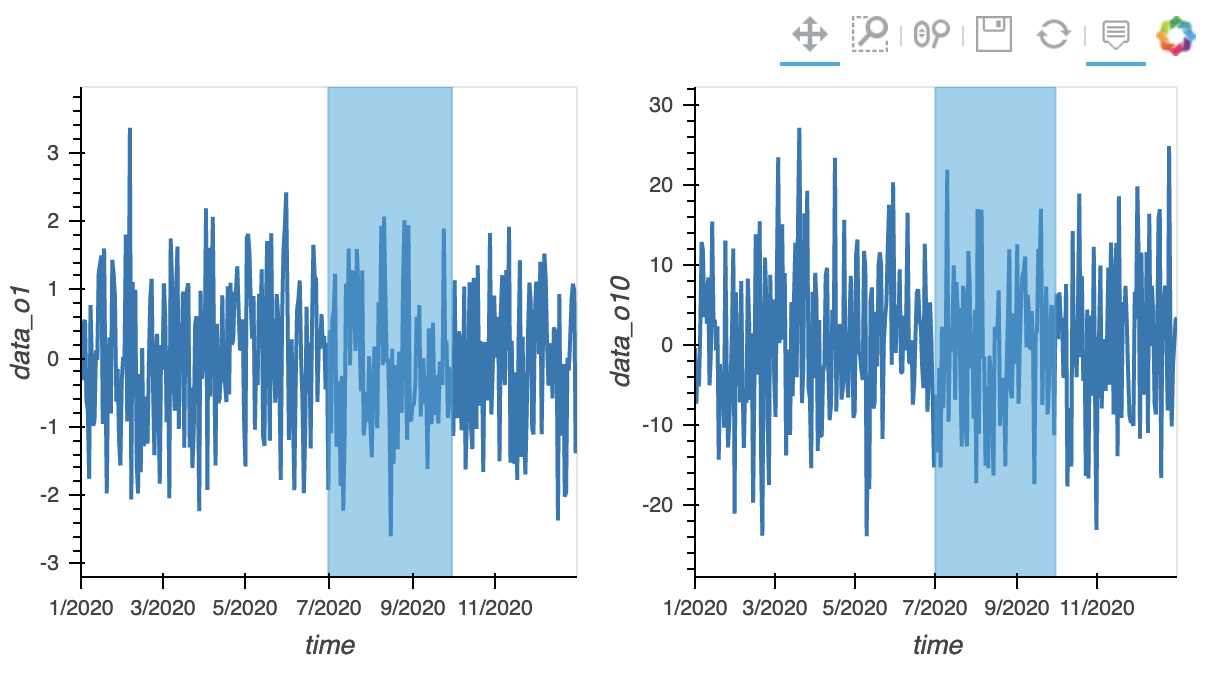
But how do I put the VSpan in the background?