I’m not having any success getting a log scale on my colorbar for a hvplot quadmesh. Here’s a minimal example:
import hvplot.xarray
import xarray as xr
ds = xr.tutorial.open_dataset("rasm").load()
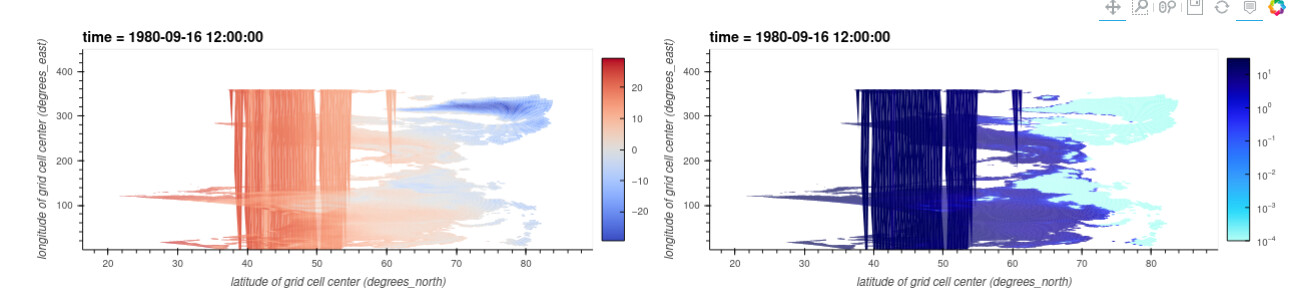
p = ds.Tair.isel(time=0).hvplot.quadmesh(logz=False) # plots as expected
p_log = ds.Tair.isel(time=0).hvplot.quadmesh(logz=True) # shows blank plot with unlabeled colorbar
hvplot.show(p + p_log)
I’m sure I’m misunderstanding something simple, but I’ve read all the docs and hv.help() items I can find. I’ve tried all manner of setting cnorm, clim, and logz in the arguments to hvplot.quadmesh() and as opts via hvplot.quadmesh(...).opts(logz=True, etc.). Any help appreciated!
oh, snap… thanks so much @Hoxbro. The Tair dataset was just a readily-available standin dataset for my reproducible example; my real data have a lower bound of 0.0, also problematic for logarithms. Setting my clim lower limit to 0.001 solved it for me. I’d been pulling my hair out on the plotting arguments for 90 minutes without suspecting high school math to be causing the problem