How to use only part of a colormap without redim.range()?

I have a elevation dataset in GeoTIFF format, the values ranging from 0 to 5000 meters. I want to use the Terrain colormap, but only the top 75% of it as the bottom 25% is a blueish shade giving the impression the area being under water which is not the case.
I can use redim.range(), but I have to set the min value of the colorbar to some arbitrary negative value so now my colorbar will spread from -1666 to 5000 instead of the real data range. I can use plt.Normalize a matplotlib colormap, but I can not pass that directly to Holoviews, I have to export the colors at specific points and pass that list to Holoviews, but now I have distinct color range instead of a continuous one.

Is there a way to only use a part of a continuous colormap without having to redim my data or export the colors as a distinct list? Thanks!

1 Like

Hi @SteveAKopias

Could you provide a minimum, reproducible example with code and screenshots or videos? That would make it much easier for the community to understand the problem and provide a specific answer. And as a side effect the community knowledge and code base would have increased.

Thanks.

Did you tried to use opts(clim=(vmin,vmax)) ?

1 Like

I’ve created a notebook with everything I’ve tried as to reproduce it you need the datafile too and this is the easiest way to share it as a whole:

This is what I get if I simply use the “terrain” colormap:

hv_image_basic = hv.Image(hv_dataset).opts(cmap='terrain', title='Basic')


The blue colors are misleading as those areas are above the water line too. Now this is how the colormap should work given values below and above ground level, creating a visualization that differentiates between ground and water. In this case however our dataset contains positive values, nothing below ground level, so what we want is to discard the blue part of the colormap and start from there.

hv_image_clim = hv.Image(hv_dataset).opts(cmap='terrain', clim=(-1666, 5007), title='clim')
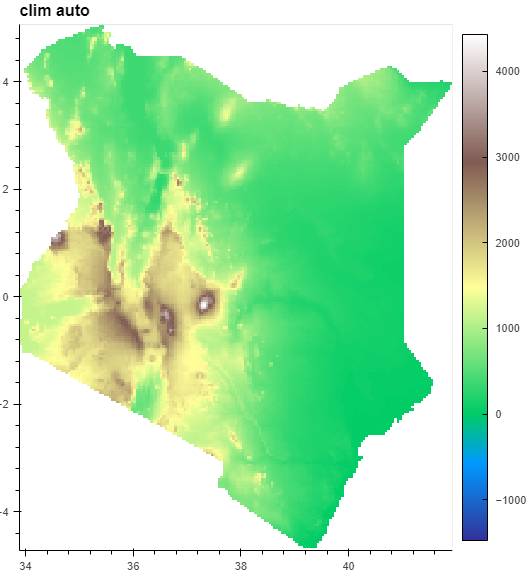

The clim solution gives us the image we want, but it has two main problems:

  • Now the colorbar shows a range from -1666 even though our data starts at 0, which is expected as we just forced it to do this, but this is not what we want.

  • Also we just gave it some arbitrary numbers that may work for this exact dataset, but not necessarily for others as if the max value of the dataset would be twice as much, our artificial lower bound should be lower too:

    min_val = float(hv_dataset.data[‘elevation’].min())
    max_val = float(hv_dataset.data[‘elevation’].max())
    val_range = max_val - min_val
    artificial_min = int(min_val - (val_range / 3))
    hv_image_clim_auto = hv.Image(hv_dataset).opts(cmap=‘terrain’, clim=(artificial_min, max_val), title=‘clim auto’)

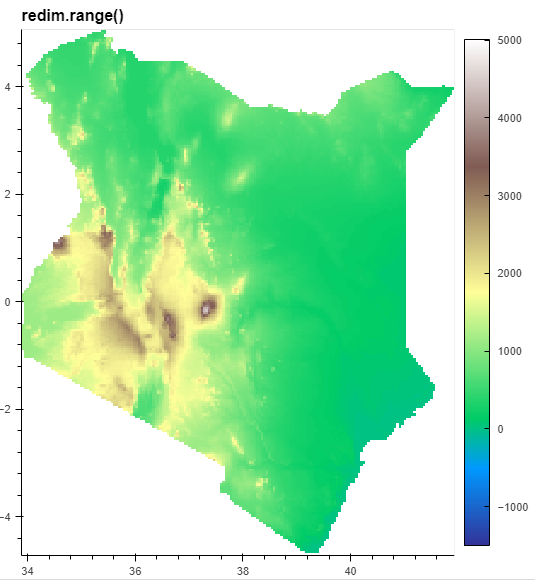
The clim solution with automatic values solves the second problem, now the data will always fall at the top 75% of the colormap no matter how big the highest value is. But we still have the missized colorbar.

hv_image_redim = hv.Image(hv_dataset).opts(cmap='terrain', title='redim.range()').redim.range(elevation=(-1500, 5007))

redim.range() gives the exact same result as clim. We could automate the values the same way, but the colorbar is still wrong.

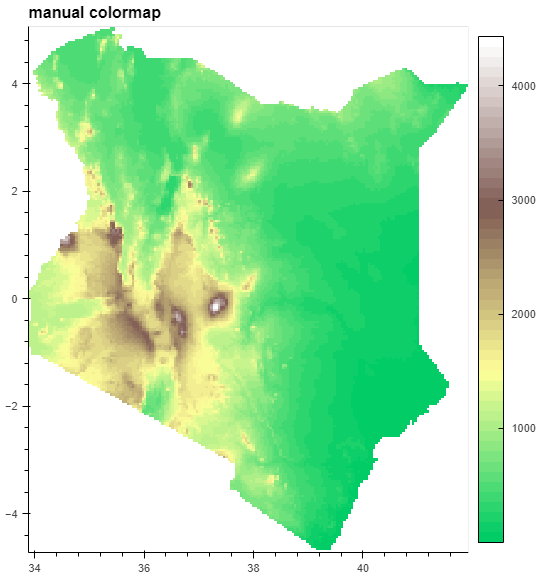
So let’s try another direction and give the image exactly the colormap we want to see. I had an old export laying around with the top 75% of the terrain colormap exported into 50 colors, let’s see that:

manually_exported_colormap = ['#01CC66', '#0DCE68', '#1DD16B', '#2DD56F', '#3DD872', '#4DDB75', '#5DDE78', '#6DE17B', '#7DE57F', '#8DE882', '#9DEB85', '#ADEE88', '#BDF18B', '#C8F48E', '#D9F791', '#E8FA94', '#F9FD97', '#FAF896', '#F2EE91', '#EAE48D', '#E2D989', '#DACF85', '#D2C580', '#CABB7C', '#C2B078', '#BCA974', '#B39F70', '#AC946C', '#A38A67', '#9C8063', '#93765F', '#8C6B5A', '#836156', '#836058', '#8B6A63', '#93746E', '#9B7F79', '#A18681', '#A8908B', '#B19B96', '#B9A5A1', '#C1AFAB', '#C8B9B6', '#D1C4C1', '#D9CECC', '#E1D8D6', '#E8E2E1', '#F1EDEC', '#F9F7F6', '#FFFFFF']
hv_image_list_manual = hv.Image(hv_dataset).opts(cmap=manually_exported_colormap, title='manual colormap')

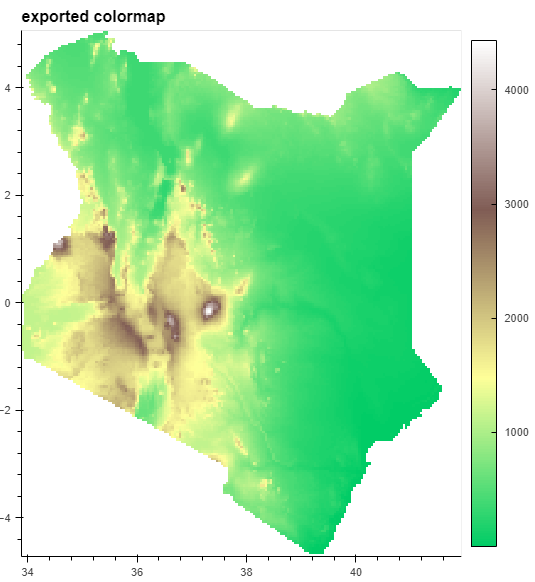
Now everything looks right at first glance, except that now we have few distinct colors, so both the colorbar and the image itself show heavy banding. Let’s se it with more colors then. For that we start from the original matplotlib colormap and export the desired amount of colors.

# 3 step export:
# - creating the 0.25-1 range we want to export, with 512 steps
# - for each step exporting the color at that position in the original colormap
# - for each export converting it to #RRGGBB format
cmap_terrain_top_75_percent_512 =  [matplotlib.colors.rgb2hex(c) for c in plt.cm.terrain(np.linspace(0.25, 1, 512))]
hv_image_list_auto_512 = hv.Image(hv_dataset).opts(cmap=cmap_terrain_top_75_percent_512, title='exported colormap')

This worked, but just feels wrong. We just arbitrarily decided to create a list with 512 elements. Is that too much, causing performance issues? Is that too few, still causing banding? Well, I have no idea about the first question, but we can check the second one.

print('the first 15 colors: ', cmap_terrain_top_75_percent_512[0:15])

the first 15 colors: [‘#01cc66’, ‘#01cc66’, ‘#01cc66’, ‘#05cd67’, ‘#05cd67’, ‘#05cd67’, ‘#09ce68’, ‘#09ce68’, ‘#0dcf69’, ‘#0dcf69’, ‘#0dcf69’, ‘#11cf69’, ‘#11cf69’, ‘#11cf69’, ‘#15d06a’]

Okay, so in this case every 2-3 colors are the same, meaning we asked for more distinct colors the colormap possibly could provide. For this colormap. Is this the same for every colormap? Are there colormaps where we should use a bigger number? Is there any other way to know that other than running through every colormap and trying out increasing amounts of colors to see where the repetition starts?

So my current solution looks okay, and I’m completely fine with in practice, but it just feels like I’m doing something wrong with handling everything colormap-related manually, exporting a huge list and then importing it. It just feels like I missed a feature somewhere that would let me tell Holoviews to do all this and not reinvent the wheel. Like if I can give Holoviews just the name of a colormap and it can work directly with that colormap, meaning it already samples the colors it needs, then it is possible that there is a parameter that would le me tell it to use only the top colormap from 0.25 to 1 and I just did not find that.

1 Like

I have used cmasher to get a sub-colormap. Using it in this case would look something like this:

import cmasher as cmr

cmap = cmr.get_sub_cmap(plt.cm.terrain, 0.25, 1.0)

Interesting, thanks!

!pip install cmasher -q
import cmasher as cmr
hv.extension('bokeh', logo=False)
cmasher_cmap = cmr.get_sub_cmap(plt.cm.terrain, 0.25, 1.0)
print('cmasher_cmap: ', cmasher_cmap)
hv_image_cmasher_cmap = hv.Image(hv_dataset).opts(cmap=cmasher_cmap, title='cmasher_cmap')
hv_image_cmasher_cmap

At first look it does what it should. But if we print cmasher_cmap.colors, we’ll see that it is still basically a list with 192 colors, so we still exporting and importing distinct colors just as we did in my last example (hence the “ListedColormap” type instead of the “LinearSegmentedColormap” the terrain itself is). But this time for the price of an extra dependency, we can do it way more neatly, which can be a good deal for some, but still leaves me with the feeling that this shouldn’t be handled outside…

1 Like

Maybe no need for cmasher: hv.plotting.util.process_cmap('RdBu_r', 10)

2 Likes

Based on this answer, now I think that there is no better way to handle this than to export a list of colors from wherever and import it back. It looks like Bokeh itself only deals with lists, and similarly ,the first thing Holoviews does when gets a matplotlib colormap name is that it converts that to a list, exactly with the process_cmap function mentioned by @ahuang11 .

https://stackoverflow.com/questions/67118061/how-to-get-bokeh-to-interpolate-a-palette-from-3-colors

As of version 2.3.1, palettes are just lists of colors, and currently existing colormappers just use palettes, as given, without modifying them. If you want more colors you would need to interpolate the palette (list of colors) out to whatever size you want before passing it to Bokeh. The “Linear” in LinearColorMapper refers to how values are linearly mapped into the bins defined by a palette.

So to sum up, depending on your needs, these could be the best solutions to get a palette with one (or both) side cut off:

# If you don't mind a busy code but don't want to install/import new dependencies 
# and already use numpy and matplotlib
# this creates a "terrain" palette from 25% to100% with 192 colors inbetween
cmap =  [matplotlib.colors.rgb2hex(c) for c in plt.cm.terrain(np.linspace(0.25, 1, 192))]


# If you want to use it often, it would be easier to create a function and call that every time.
# I've also included the possibility to start with a palette of a few colors and interpolate the rest of the
# colors.
def get_palette(cmap='Greys', n=192, start=0, end=1):
  linspace = np.linspace(start, end, n)
  if isinstance(cmap, list):
    cmap = matplotlib.colors.LinearSegmentedColormap.from_list("customcmap", camp)
    palette = cmap(linspace)
  elif isinstance(cmap, str):
    cmap = matplotlib.pyplot.cm.get_cmap(cmap)
    palette = cmap(linspace)
  else:
    palette = cmap(linspace)

  hex_palette = [matplotlib.colors.rgb2hex(c) for c in palette]
  return hex_palette

cmap = get_palette('terrain', 192, 0.25, 1)
cmap = get_palette(['#FF0000', '#00FF00', '#0000FF'], 192, 0.25, 1)


# If you want to heave shorter code and are okay with installing and importing cmasher
# this creates the exact same result:
import cmasher
cmap = cmasher.get_sub_cmap(plt.cm.terrain, 0.25, 1.0, N=192)

A bit tangential but if anybody reads this I would highly recommend checking out the cmocean colormaps as they are very good perceptually uniform, colorblind-safe, grayscale-printable colormaps. If you install and import the cmocean package, the colormaps are automatically will be available in matplotlib, so for example get_palette('cmo.haline', 192, 0.25, 1) would work just the same. Of course if you only intend to use cmocean colormaps and already importing the module, you can also use its cmocean.tools.crop_by_percent() and cmocean.tools.crop() documented at the link above.