Hi All,
how to use pn indicator trend? for example I have synthetic data showing sales over the month, how I make indicator trend for year on year or montly sales trend
import pandas as pd
import panel as pn
# Sample data (replace this with your actual data)
data = {
'Date': pd.date_range(start='2020-01-01', periods=12, freq='M'),
'Sales': [100, 120, 150, 130, 110, 140, 160, 180, 200, 220, 250, 230]
}
df = pd.DataFrame(data)
# Calculate year-over-year sales
df['YoY_Sales'] = df['Sales'].pct_change(periods=12) * 100
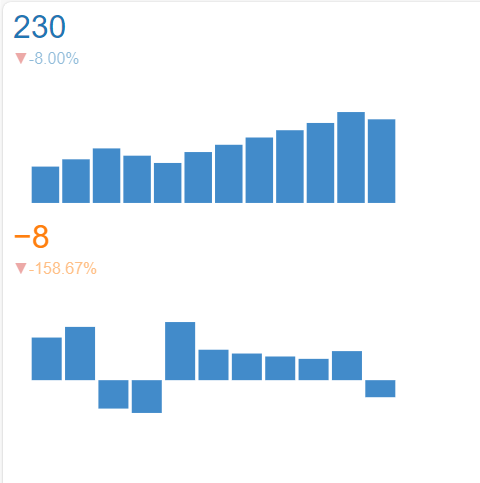
# Create the Trend indicator for monthly car sales
trend_indicator = pn.indicators.Trend(df['Sales'], style={'color': '#1f77b4'})
# Create the Trend indicator for year-over-year car sales
yoy_trend_indicator = pn.indicators.Trend(df['YoY_Sales'], style={'color': '#ff7f0e'})
# Create the Panel layout
app_layout = pn.Column(
trend_indicator,
yoy_trend_indicator
)
# Display the app
app_layout.servable()
I run that code above and error.
if I just follow example from panel documentation
import pandas as pd
import panel as pn

# Sample data (replace this with your actual data)
data = {
    'Date': pd.date_range(start='2020-01-01', periods=12, freq='M'),
    'Sales': [100, 120, 150, 130, 110, 140, 160, 180, 200, 220, 250, 230]
}

df = pd.DataFrame(data)


trend = pn.indicators.Trend(
    name='Price', data=df, width=200, height=200
)
trend
result wil be zero %
kindly please advise to use this great function.
thanks