My use case is essentially to embed a datashader based figure into an existing native bokeh application while also utilizing the interactive rerendering features (reapply datashading on zoom).
My example code looks as follow is mainly working as intended however there are still some issues.
First of all I am not sure how Pipe, DynamicMap and datashade are supposed to interact? Unfortunately there is little to no documentation for this scenario.
Secondly getting the bokeh figure from the respective Holoviews object does not seem to be straight forward: i.e. using hv.renderer vs. the specified renderer. In the former case an error will be triggered: RuntimeError: _pending_writes should be non-None when we have a document lock, and we should have the lock when the document changes
Thirdly the figure is not always behaving as intended:
- After zooming in multiple times the reset button isn’t working any more or just reset to the previous zoom state
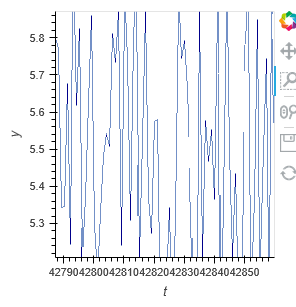
- The zoomed image occasionally shows some gaps in the line plot (see image this also happnes with webgl turned off)
- Zooming itself does work consistently and often resets to current zoom stage during the zooming interaction (axis briefly change but then reset which results in being stuck within the same zooming stage)
Overall I am unsure if I am using the wrong APIs which triggers the issues described above.
import pandas as pd
import numpy as np
import datashader as ds
from holoviews.plotting.util import process_cmap
import datashader.transfer_functions as tf
from collections import OrderedDict as odict, OrderedDict
import holoviews as hv
import holoviews.plotting.bokeh
from holoviews.operation.datashader import datashade
from bokeh.layouts import row
from bokeh.models import Button, ColumnDataSource, CDSView, DataTable, IndexFilter, TableColumn
from bokeh.plotting import curdoc, figure
from bokeh.layouts import layout
from holoviews import opts
from holoviews.operation.datashader import datashade, shade, dynspread, spread, rasterize
from holoviews.streams import Pipe
from holoviews.plotting.links import RangeToolLink

hv.extension('bokeh')
renderer = hv.renderer('bokeh').instance(mode='server')
renderer.webgl = True

doc = curdoc()

# dummy timeseries data
n_samples = 100000
data_ts = np.empty((n_samples, 3), dtype=np.float32)
data_ts[:, 0] = np.arange(0, n_samples, 1)
data_ts[:, 1] = np.random.rand(n_samples)
data_ts[:, 2] = np.random.rand(n_samples) + 5
df_ts = pd.DataFrame(data_ts, columns=["t", "x", "y"])


def data(data):
    return hv.Curve(data, "t", "y").opts(framewise=True, width=900)


pipe = Pipe(data=[])


ts_dmap = hv.DynamicMap(data, streams=[pipe]).opts(framewise=True)
ts = datashade(ts_dmap, cnorm='eq_hist', interpolation="default", aggregator=ds.count(), min_alpha=100).opts(
    framewise=True)  # cmap=process_cmap("Magma", provider="bokeh")

pipe.send(df_ts)


#fig = hv.render(ts)
fig = renderer.get_plot((ts)).state

button = Button(label='DummyButton', width=200)

layout = layout([[button, fig]])
doc.add_root(layout)