Hi all,
Is it possible to wrap an existing plot into HoloViews so that it can interact with other elements as usual? It will be handy when a corresponding Element type is unavailable.
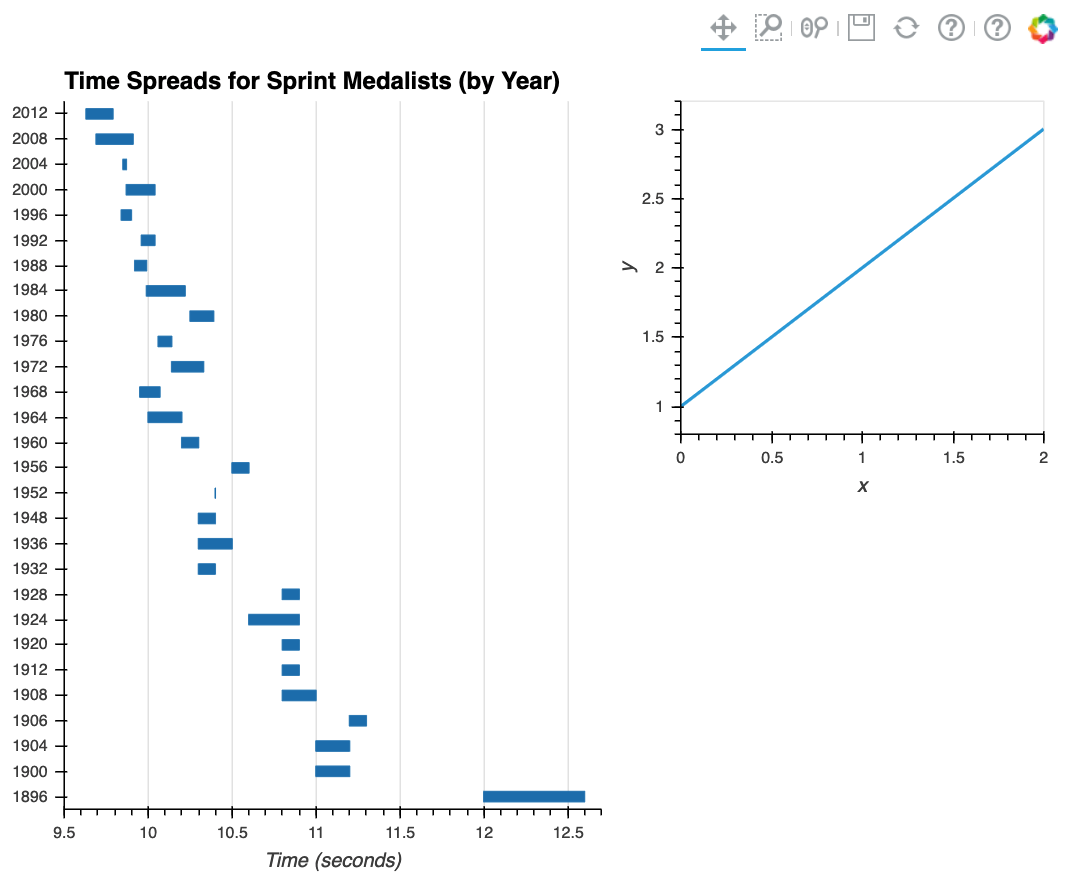
For example, how to make the following plot available in HoloViews? Thanks
from bokeh.io import show, output_file
from bokeh.models import ColumnDataSource
from bokeh.plotting import figure
from bokeh.sampledata.sprint import sprint

output_file("bar_intervals.html")

sprint.Year = sprint.Year.astype(str)
group = sprint.groupby('Year')
source = ColumnDataSource(group)

p = figure(y_range=group, x_range=(9.5,12.7), plot_width=400, plot_height=550, toolbar_location=None,
           title="Time Spreads for Sprint Medalists (by Year)")
p.hbar(y="Year", left='Time_min', right='Time_max', height=0.4, source=source)

p.ygrid.grid_line_color = None
p.xaxis.axis_label = "Time (seconds)"
p.outline_line_color = None

show(p)
So this is a bit of hack and doesn’t support some of the features usually supported by other elements but it at least makes it possible to embed a static bokeh figure in a HoloViews layout. It does not support overlaying (with *) or updating in a DynamicMap and/or HoloMap:
from holoviews.core import Element
from holoviews.plotting.bokeh import ElementPlot

class BokehPlot(Element):
   """
   Allows embedding a bokeh figure in a HoloViews layout.
   """

class BokehFigurePlot(ElementPlot):

    def initialize_plot(self, ranges=None, plot=None, plots=None, source=None):
        plot = self.hmap.last.data
        self.handles['plot'] = plot
        return plot

hv.Store.register({BokehPlot: BokehFigurePlot}, 'bokeh')

BokehPlot(p) + hv.Curve([1, 2, 3])
If you just need to lay out a plot like this it probably ends up being cleaner to just use Panel to compose the HoloViews and Bokeh plots.
A belated but big thank you. Indeed I used Panel to compose the plots. Thank you again.
2 Likes
Even I you have deleted your message, here is a quick example of streaming candlestick:
import yfinance as yf
import holoviews as hv
hv.extension('bokeh')

msft = yf.Ticker("MSFT")
df = msft.history(period="1y", interval='1d').reset_index()
t_delta = np.median(np.diff(df.Date))
df['Start'] = df.Date - t_delta/4 # rectangles start
df['End'] = df.Date + t_delta/4 # rectangles end
df['Positive'] = ((df.Close - df.Open)>0).astype(int)

def make_candle_stick(data):
    candlestick = hv.Segments(data, kdims=['Date', 'Low', 'Date', 'High']) * hv.Rectangles(data, kdims=['Start','Open', 'End', 'Close'], vdims=['Positive'])
    candlestick = candlestick.redim.label(Low='Values')
    return candlestick.opts(hv.opts.Rectangles(color='Positive', cmap=['red', 'green'], colorbar=True), hv.opts.Segments(color='black'))
dfstream = hv.streams.Buffer(data=df.iloc[:2], length=30, index=False)
hv.DynamicMap(make_candle_stick, streams=[dfstream]).opts(responsive=True, height=400, show_grid=True)
And to stream data:
import time
def make_data():
    count = 2
    while True:
        count += 1
        yield df.iloc[count-1:count]
data = make_data()
for i in range(len(df)-2):
    time.sleep(0.1)
    dfstream.send(next(data))
4 Likes