Huge Performance hit when template is used vs running the app on Jupyter Notebook

I’m experiencing huge performance hit when using template and serving an application containing Bokeh plots to a new browser window, vs running the same application but without template on a Jupyter Notebook.

In the following example, BokehPlot is a class responsible to create a figure, and updating it as new values of parameters come in.

InteractivePlot is a parameterized class: it accepts any number of instances of BokehPlot and arrange them in a GridSpec layout. There is two modes of operation:

  1. InteractivePlot(plot1, plot2, servable=False).show() : the app is run on Jupyter Notebook. Interactivity is fast, the app feels snappy.

  2. InteractivePlot(plot1, plot2, servable=True).show() : the app is launched on a new browser window and a template is applied. Users might want to use this mode when the number of parameters is getting big, or when there are many plots to show. However. interactivity is bad, there is a lot of lag.

What can I do to improve performance?

import panel as pn
import numpy as np
import param
import bokeh
pn.extension()

class BokehPlot:
    def __init__(self, *functions):
        self.f = functions
        self.x = np.logspace(-1, 1, 1000)
        self._fig = None
    
    @property
    def fig(self):
        if self._fig is None:
            self.create_figure()
        return self._fig
    
    def create_figure(self):
        TOOLTIPS = [("x", "$x"), ("y", "$y")]
        self._fig = bokeh.plotting.figure(
            x_axis_type="log",
            tools="pan,wheel_zoom,box_zoom,reset,hover,save",
            tooltips=TOOLTIPS
        )
        for f in self.f:
            source = {
                "xs": self.x,
                "ys": f(1, 0.1, 7.5, 1, 0.12, 9, self.x)
            }
            self._fig.line("xs", "ys", source=source, line_width=2)
    
    def update_figure(self, v):
        for i, f in enumerate(self.f):
            source = {
                "xs": self.x,
                "ys": f(*v, self.x)
            }
            self._fig.renderers[i].data_source.data.update(source)
    
    def show(self):
        bokeh.plotting.show(self.fig)

        
def _new_class(cls, **kwargs):
    "Creates a new class which overrides parameter defaults."
    return type(type(cls).__name__, (cls,), kwargs)


class InteractivePlot(param.Parameterized):
    a = param.Number(1, bounds=(-10, 10))
    b = param.Number(0.1, bounds=(-1, 1))
    c = param.Number(7.5, bounds=(-10, 10))
    d = param.Number(1, bounds=(-10, 10))
    e = param.Number(0.12, bounds=(-1, 1))
    f = param.Number(9, bounds=(-10, 10))
    
    check_val = param.Integer(default=0)
    
    def __init__(self, *plots, servable=False):
        super().__init__()
        self.plots = plots
        self.servable = servable
        
        self._parameters = ["a", "b", "c", "d", "e", "f"]
        widgets = {}
        for name in self._parameters:
            self.param.watch(self._increment_val, name)
            widgets[name] = {"type": pn.widgets.FloatSlider}
        
        self.controls = pn.Param(
            self,
            parameters=self._parameters,
            widgets=widgets,
            default_layout=_new_class(pn.GridBox, ncols=1 if self.servable else 2),
            show_name=False,
            sizing_mode="stretch_width",
        )
    
    def _increment_val(self, *depends):
        self.check_val += 1
    
    @param.depends("check_val", watch=True)
    def update(self):
        values = [getattr(self, p) for p in self._parameters]
        for pane, plot in zip(self.panes, self.plots):
            plot.update_figure(values)
            fig = plot.fig
            pane.param.trigger("object")
            pane.object = fig
    
    def show(self):
        gs = pn.GridSpec(height=600)
        self.panes = []
        for i, p in enumerate(self.plots):
            fig = p.fig
            pane = pn.pane.panel(fig)
            gs[i, 0] = pane
            self.panes.append(pane)
        
        if not self.servable:
            return pn.Column(self.controls, gs)
        
        templ = pn.template.BootstrapTemplate()
        templ.sidebar.append(self.controls)
        templ.main.append(gs)
        return templ.servable().show()


def f1(a, b, c, d, e, f, w):
    return 20*np.log(np.abs((-w**2*a + w*1j*b + c)/(-w**4*d + w**3j*e + w**2*f)))/np.log(10)
def f2(a, b, c, d, e, f, w):
    return np.angle((-w**2*a + w*1j*b + c)/(w**2*(w**2*d - w*1j*e - f)))

p1 = BokehPlot(f1)
p2 = BokehPlot(f2)
# change servable=True to servable=False to run it on Jupyter Notebook
InteractivePlot(p1, p2, servable=True).show()

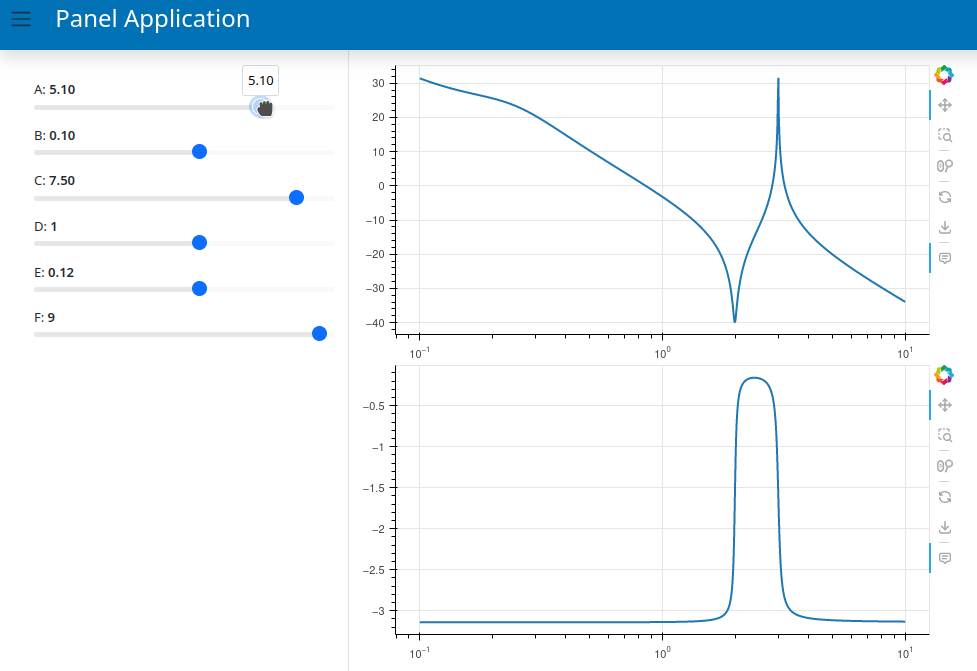
Here are a couple of screen records. Running on Jupyter Notebook (fast response):

app_servable_false

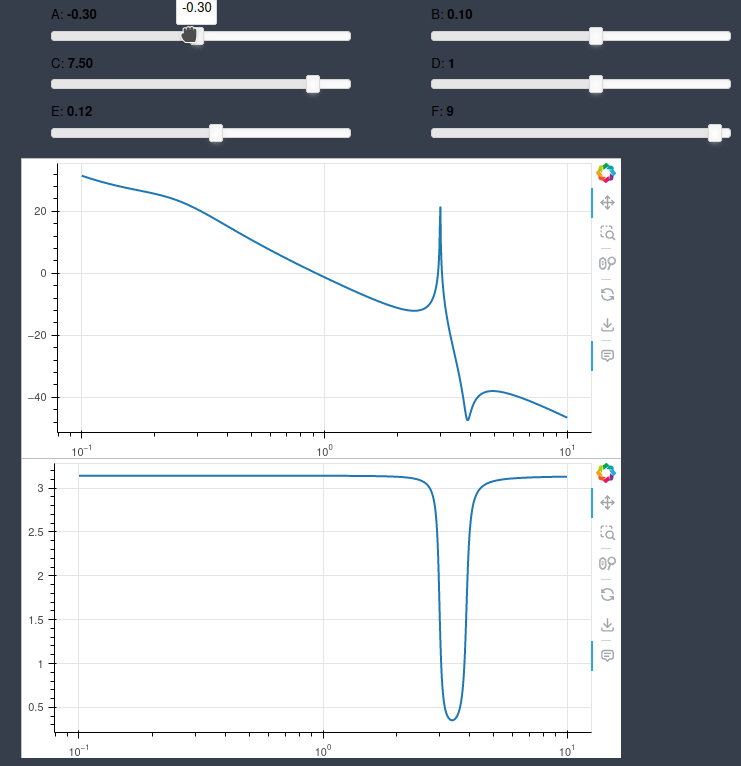
Running on a browser window (note the lags):

app_servable_true

I would again advise you not to use servable and show together. Run this with panel serve FILENAME

With that being said, it seems to be sluggish. I think this is related to GridSpec when using a theme. I will investigate further.

import bokeh
import numpy as np
import panel as pn
import param

pn.extension()


class BokehPlot:
    def __init__(self, *functions):
        self.f = functions
        self.x = np.logspace(-1, 1, 1000)
        self._fig = None

    @property
    def fig(self):
        if self._fig is None:
            self.create_figure()
        return self._fig

    def create_figure(self):
        TOOLTIPS = [("x", "$x"), ("y", "$y")]
        self._fig = bokeh.plotting.figure(
            x_axis_type="log",
            tools="pan,wheel_zoom,box_zoom,reset,hover,save",
            tooltips=TOOLTIPS,
        )
        for f in self.f:
            source = {"xs": self.x, "ys": f(1, 0.1, 7.5, 1, 0.12, 9, self.x)}
            self._fig.line("xs", "ys", source=source, line_width=2)

    def update_figure(self, v):
        for i, f in enumerate(self.f):
            source = {"xs": self.x, "ys": f(*v, self.x)}
            self._fig.renderers[i].data_source.data.update(source)

    # def show(self):
    #     bokeh.plotting.show(self.fig)


def _new_class(cls, **kwargs):
    "Creates a new class which overrides parameter defaults."
    return type(type(cls).__name__, (cls,), kwargs)


class InteractivePlot(param.Parameterized):
    a = param.Number(1, bounds=(-10, 10))
    b = param.Number(0.1, bounds=(-1, 1))
    c = param.Number(7.5, bounds=(-10, 10))
    d = param.Number(1, bounds=(-10, 10))
    e = param.Number(0.12, bounds=(-1, 1))
    f = param.Number(9, bounds=(-10, 10))

    check_val = param.Integer(default=0)

    def __init__(self, *plots, servable=False, **params):
        super().__init__(**params)
        self.plots = plots
        self.servable = servable

        self._parameters = ["a", "b", "c", "d", "e", "f"]
        widgets = {}
        for name in self._parameters:
            self.param.watch(self._increment_val, name)
            widgets[name] = {"type": pn.widgets.FloatSlider}

        self.controls = pn.Param(
            self,
            parameters=self._parameters,
            widgets=widgets,
            default_layout=pn.Column,
            show_name=False,
            sizing_mode="stretch_width",
        )

    def _increment_val(self, *depends):
        self.check_val += 1

    @param.depends("check_val", watch=True)
    def update(self):
        values = [getattr(self, p) for p in self._parameters]
        for pane, plot in zip(self.panes, self.plots):
            plot.update_figure(values)
            fig = plot.fig
            pane.param.trigger("object")
            pane.object = fig

    def show(self):
        gs = pn.GridSpec(height=600)
        self.panes = []
        for i, p in enumerate(self.plots):
            fig = p.fig
            pane = pn.pane.panel(fig)
            gs[i, 0] = pane
            self.panes.append(pane)

        gs = pn.Column(*[p.fig for p in self.plots], height=600)

        # return pn.Row(self.controls, gs).servable()

        templ = pn.template.BootstrapTemplate(main=[gs], sidebar=[self.controls])
        templ.servable()
        return templ


def f1(a, b, c, d, e, f, w):
    return 20*np.log(np.abs((-w**2*a + w*1j*b + c)/(-w**4*d + w**3j*e + w**2*f)))/np.log(10)


def f2(a, b, c, d, e, f, w):
    return np.angle((-w**2*a + w*1j*b + c)/(w**2*(w**2*d - w*1j*e - f)))


if pn.state.served:
    p1 = BokehPlot(f1)
    p2 = BokehPlot(f2)
    # change servable=True to servable=False to run it on Jupyter Notebook
    InteractivePlot(p1, p2).show()

I would again advise you not to use servable and show together. Run this with panel serve FILENAME

Thanks for the advice, but I think that’s not an option for my case. The example shown above is an extreme simplification of what this module does: users working inside Jupyter Notebook expects to plot any symbolic expression containing any number of parameters. So they execute plot_something(expr, params={...}) and away they go. If the decide to use the entire screen space, they set servable=True.

I believe that your suggestion over-complicates things a lot, because I would need to save the symbolic expression into a file, then programmatically launch a new process to execute panel serve APP_FILENAME, which is going to load the previously saved file… A lot of work, and for what advantages?

My suggestion was not to say you should rewrite your code but how I would do it.

It is fundamentally wrong to do servable().show(). .show() launches a new Bokeh Server, which can block the rest of the code. Try running this code from a Python file with python tmp.py:

import panel as pn

pn.panel("A").show()
print("B")
pn.panel("C").show()

This will launch a Server for “A,” which blocks the rest of the code. If you kill it with ctrl + c, you get the print(“B”) and then a new server is launched with “C”.

Compare this to when running panel serve tmp.py:

import panel as pn

pn.panel("A").servable()
print("B")
pn.panel("C").servable() 

This will launch a server with both A and B and print(“B”).

There are no problems using .show, but there is absolutely no point in running it with .servable. In your original code, it is not servable with launches a new window but show.

1 Like

Now I understand the differences. Thank you for the explanation!

1 Like