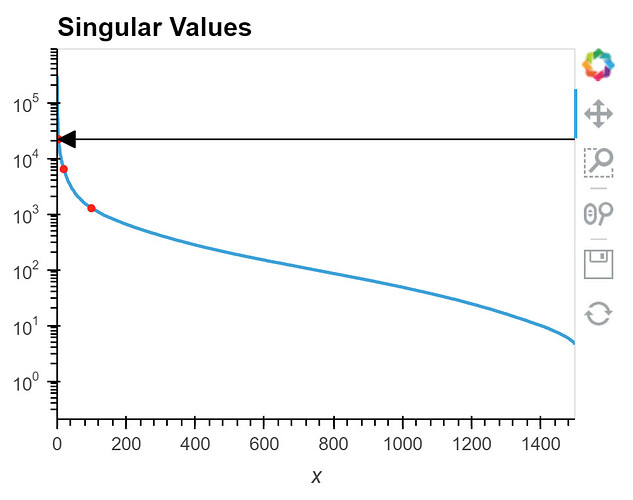
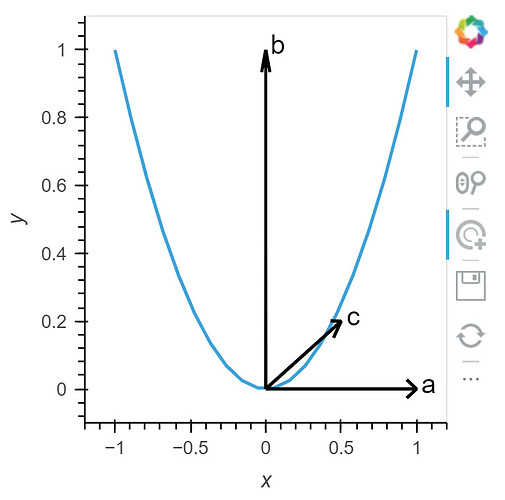
Packaged this…
class ArrowsWithLabels:
    def __init__(self):
        self.reset()

    def reset(self):
        self.G      = nx.Graph()
        self.E      = {}
        self.pos    = {}
        self.text   = {}
        self.color  = {}

    def _add( self, point_id, point_pos, lbl_id, lbl_pos, text, at_start=False, color='black' ):
        self.E[(point_id,lbl_id)]     = text
        self.color[(point_id,lbl_id)] = color
        self.pos[point_id]            = np.array(point_pos)
        self.pos[lbl_id]              = np.array(lbl_pos)
        self.text[point_id if at_start else lbl_id] = {"text" : text, "color": color}

    def _add_lbl( self, lbl_id, point_id, delta, text, color="black" ):
        #print( f"adding {delta} for {lbl_id} to current {point_id} at {self.pos[point_id]}")
        self.G.add_node(lbl_id)
        self.pos[lbl_id]  = self.pos[point_id] + delta
        self.text[lbl_id] = {"text" : text, "color": color}

    def add( self, point_pos, lbl_pos, text, at_start=False, offset=None, color='black'):
        cur = len( self.pos )+1
        if offset is None:
            self._add( cur, point_pos, cur+1, lbl_pos, text, at_start, color )
        else:
            self._add( cur, point_pos, cur+1, lbl_pos, "", at_start, color )
            diff     = self.pos[cur+1] - self.pos[cur]
            diff_pos = offset * diff / np.linalg.norm( diff)
            if at_start:
                self._add_lbl( cur+2, cur, -diff_pos, text, color)
            else:
                self._add_lbl( cur+2, cur+1, diff_pos, text, color)

    def graph(self):
        _ = [self.text.__setitem__(k,{"text": "", "color": "black"}) for k in self.pos.keys() if self.text.get(k,None) is None]

        #self.G.add_edges_from(self.E.keys())
        for e in self.E.keys():
            self.G.add_edge( *e, color=self.color[e])
        nx.set_node_attributes( self.G, self.text )
        graph  = hv.Graph.from_networkx(self.G, self.pos).opts(directed=True, node_alpha=0, arrowhead_length=0.05)
        lbls   = hv.Labels( graph.nodes, ['x', 'y'], ["text","color"]).opts(text_color='color')
        return graph,lbls

    def _dbg(self):
        print("Pos")
        for i in self.pos.keys():
            print( f".  {i, self.pos[i]}")
        print("Edge")
        for i in self.E.keys():
            print( f".  {i, self.E[i]}")
        print("Text")
        for i in self.text.keys():
            print( f".  {i, self.text[i]}")

pl = ArrowsWithLabels()
pl.add( (0,0), (1,0), "X", offset=0.1,  color='green')
pl.add( (0,0), (0,1), "Y", offset=0.05, color='green')
pl.add( (0,0), (1,1), "q_1", offset=0.1)
pl.add( (0.8,0.5*0.5), (0.5,0.5*0.5), "??", at_start=True, offset=0.1, color="red")

arrows,lbls = pl.graph()
#pl._dbg()

x = np.linspace(-1,1,20)
(hv.Curve( (x,x*x)) * arrows * lbls)\
  .opts(hv.opts.Graph( edge_color="color"),
           hv.opts.Curve( xlim = (-1,1.5), ylim = (-0.05,1.4), width=400 ))

