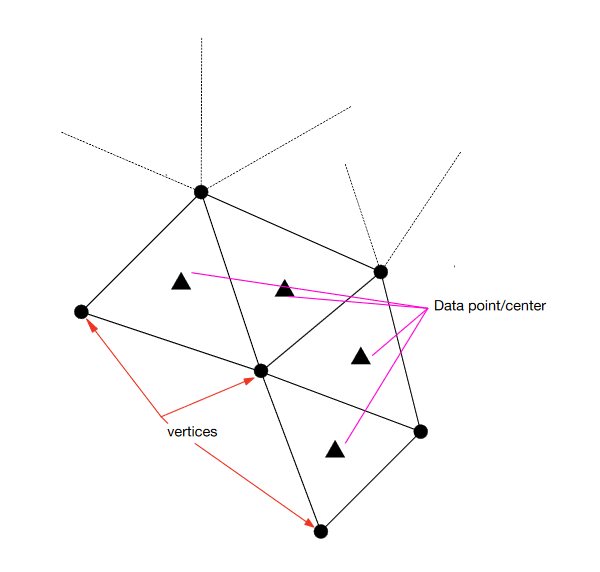
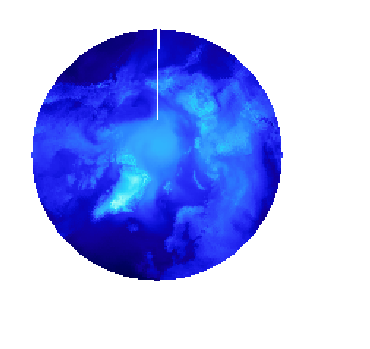
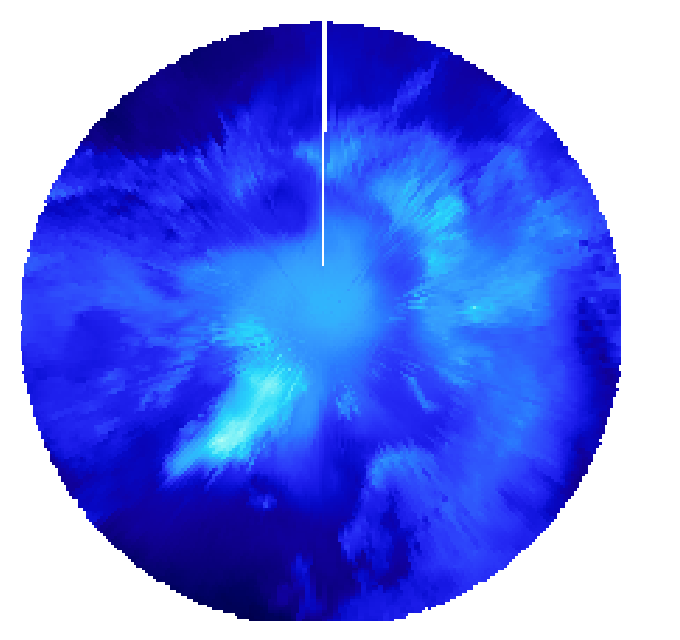
I’m trying to visualize some weather data over the pol which is on an unstructured trimesh. For that I’d like to use holoviews or geoviews. So far I used this example as a guide for my plot. I works quite well but I have an artifact in the plot at the location of the coordinate jump. I tried a lot of different things already, here is a picture to help explaining my problem:
As you can see the data I try to visualize is not at the vertices of the trimesh its located in the center. In my code I used the center points with the Delaunay triangulation. Which could lead to the following artifact in the plot.
For this plot I use Delaunay to calculate the Trimesh from the centerpoints of the triangles and then plot via geoviews:
A way I’m exploring rn is to use the Dataset I already have. The Dataset has a good set of possible Data variables, but the shape is a little problematic.
Because the simplices point towards the center and their value and the vertices are shared by the triangles hv.Trimesh has a problem to use them.
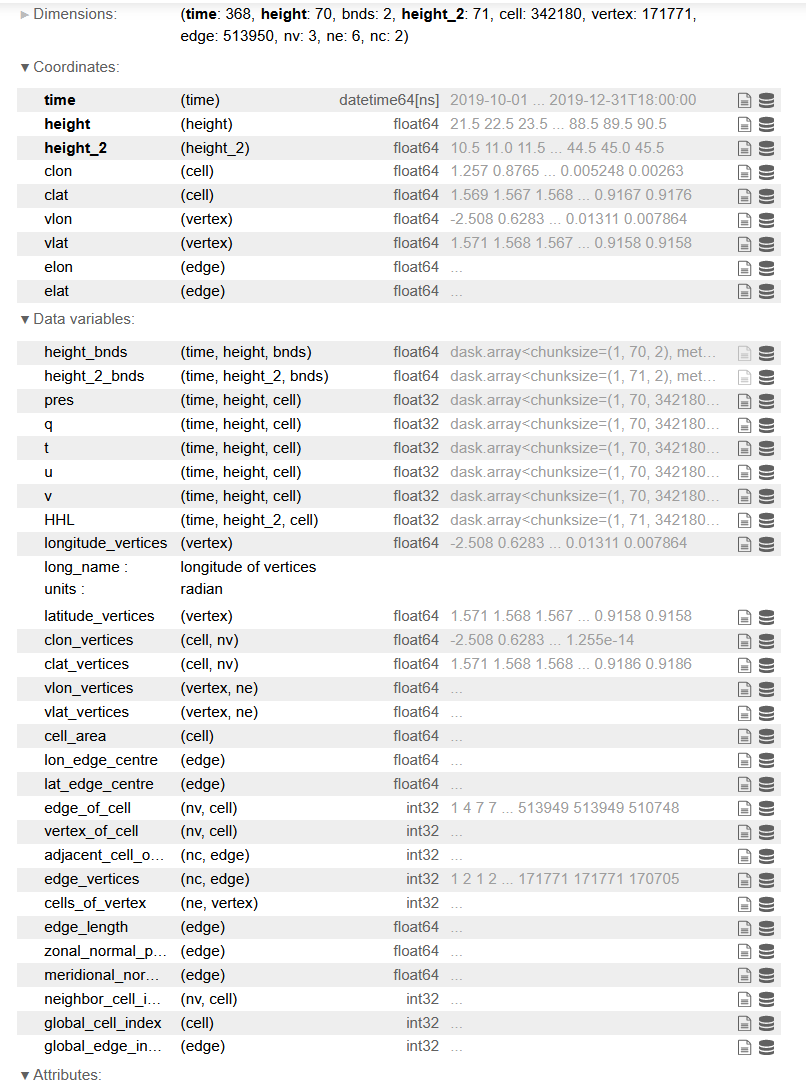
Maybe I miss something so here is the Dataset I’m using. Has anyone an Idea how to solve that and plot the data without the artifact? Maybe there is a Bug that I’m missing. I’m glad for any help.
doesn’t this just boil down to the projection you are using, i.e. the wraparound at 180degE? I don’t really understand how this relates to whether values are defined on nodes or cells. I have never had a problem with plotting data that are defined on the cells.
To be honest, I have no Idea what else it could be. I tried already a lot of different things. When I use another projection and shift the data by a few degrees, there is a missing piece as well. Also applying np.unwrap()…
Could you maybe try doing a Delauney triangulation on a manageable number of points and see if you have any triangles that cross the border where the numbers jump? My guess is that Delaunay triangulation won’t cross that border, and you’d need some triangulation that is continuous across it to get what you want. I’n no Delaunay expert (or polar mapping expert), though!
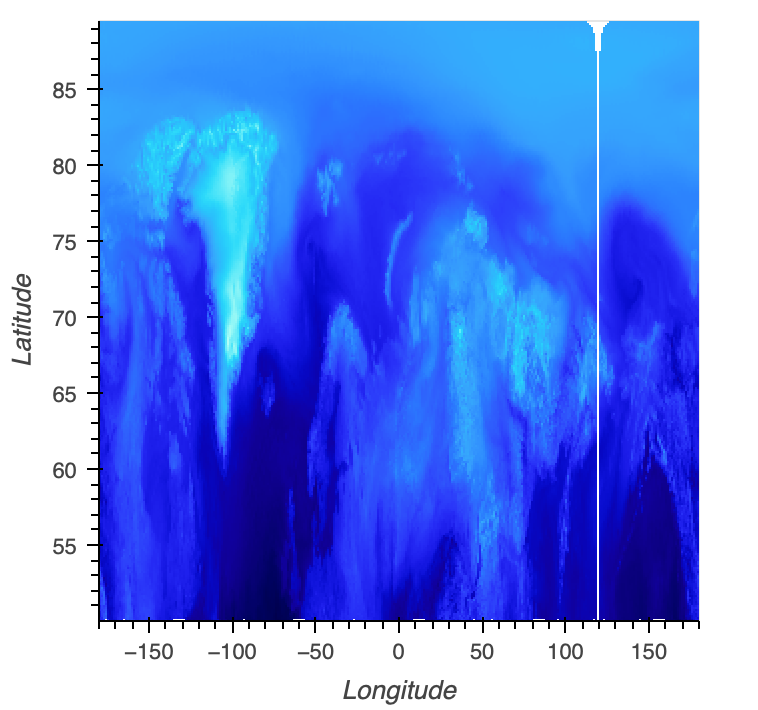
That was my first thought as well, so I tried to transform my data into Cartesian coordinates and perform a Delauney triangulation there. Due to the calculation time in 3 Dimensions I just did it in the X-Y plane. In the result there was still „gap“.
Here is the resulting plot, due to that I‘m just using the X-Y plane there are circular stripes in the plot, but I think that shouldn’t change the conclusion:
 def r(grid_in, option, SP_coor):
    lon = grid_in[0]
    lat = grid_in[1]

    lon = (lon*np.pi)/180 # Convert degrees to radians
    lat = (lat*np.pi)/180

    x = np.cos(lon)*np.cos(lat) # Convert from spherical to cartesian coordinates
    y = np.sin(lon)*np.cos(lat)
    z = np.sin(lat)

    triang = Delaunay(np.column_stack([x, y]))
    tris = pd.DataFrame(triang.simplices, columns=['v0', 'v1', 'v2'])

    return(tris)
I also used triconturf from matplotlib, which also produces artifacts at the coordinate jump. The only reliable solution is plotting polygons in matplotlib. But then it takes 2min 30s per plot, which I‘d like to improve.
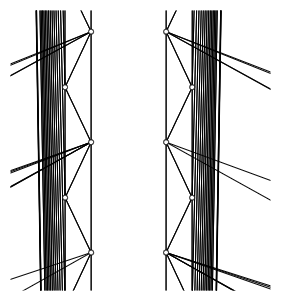
Oops; in my previous suggestion I forgot to make my main point: the reason to use a manageable number of points is that you can then visualize the trimesh directly as a mesh with each triangle outlined (here I’m suggesting using the wireframe mesh plotting TriMesh — HoloViews v1.15.4, not the usual filled triangle rendering). If you visualize that directly you should be able to debug whether there are any triangles crossing that border, and if not, you’d have to fix that first (outside of HoloViews). If there are triangles crossing the boundary and there are still issues, then I think it’s a HoloViz problem.
That was my first guess as well. It looks like that the triangles don’t cross the border. But shouldn’t that be fixed, when transforming into cartesian coordinates?
That is, what makes me think, that there are multiple things that lead to the issue…
Thanks. That helps narrow it down: if the triangle mesh doesn’t cross that boundary, the rendered representation will always have such a gap. So you’d first need to debug the mesh generation, and then (hopefully) the HoloViews rendering will just work. Hopefully you can render the Cartesian version of the mesh wirefram and figure out if that one has such a gap, and if so, address that issue (not to do with HoloViews).