Hvplot and xarray: What determines the default axes layout?

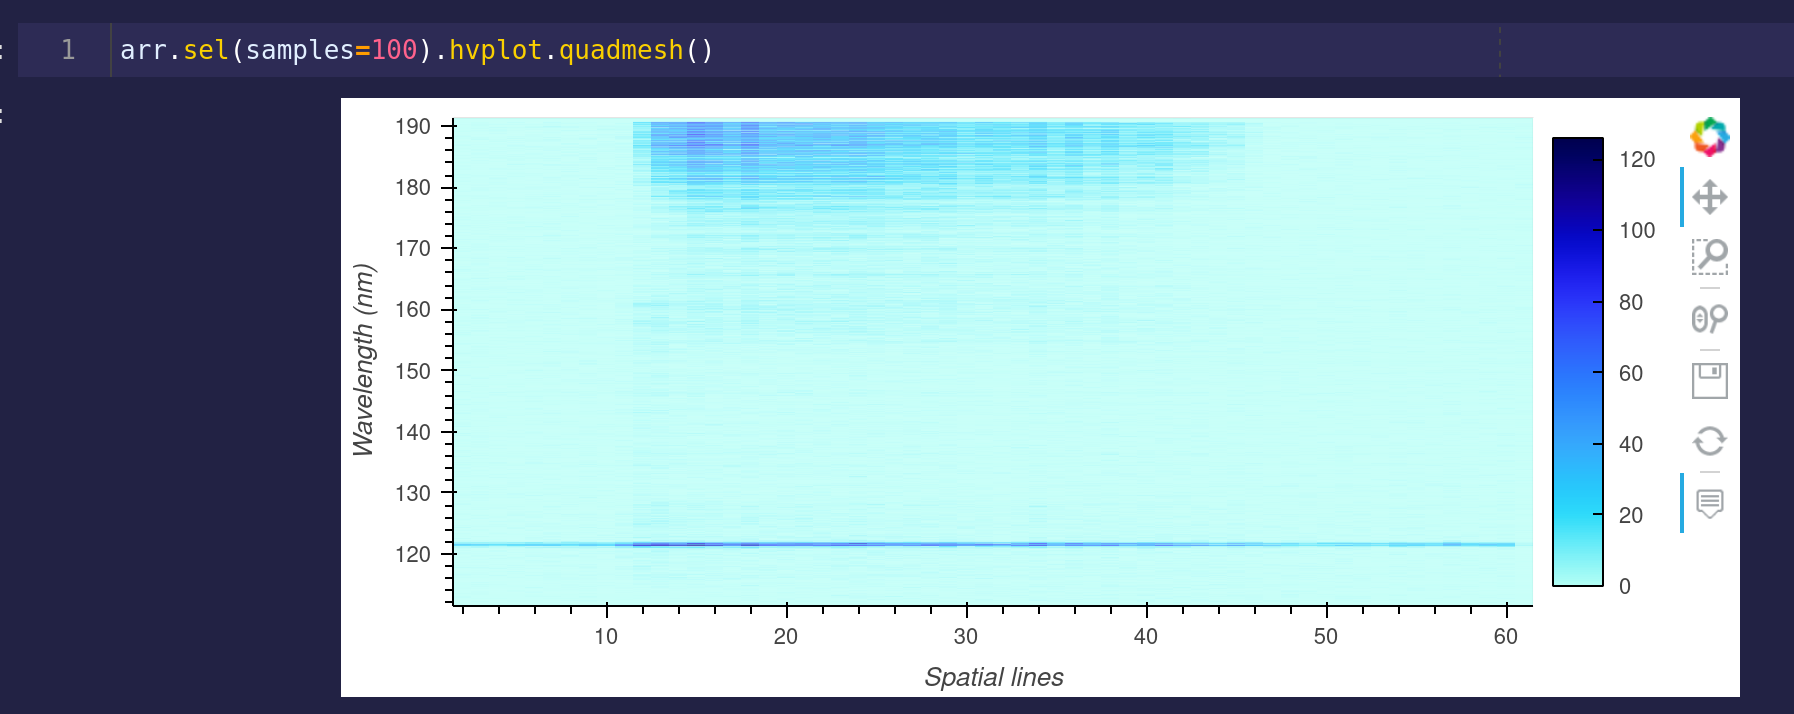
I was wondering what determines the default axes layout for a raster plot, when I don’t set x and y manually?
I happen to have the “unwanted” default (of course :slight_smile: ) in my situation:

    def xarray(self):
        arr = xr.DataArray(self.data)
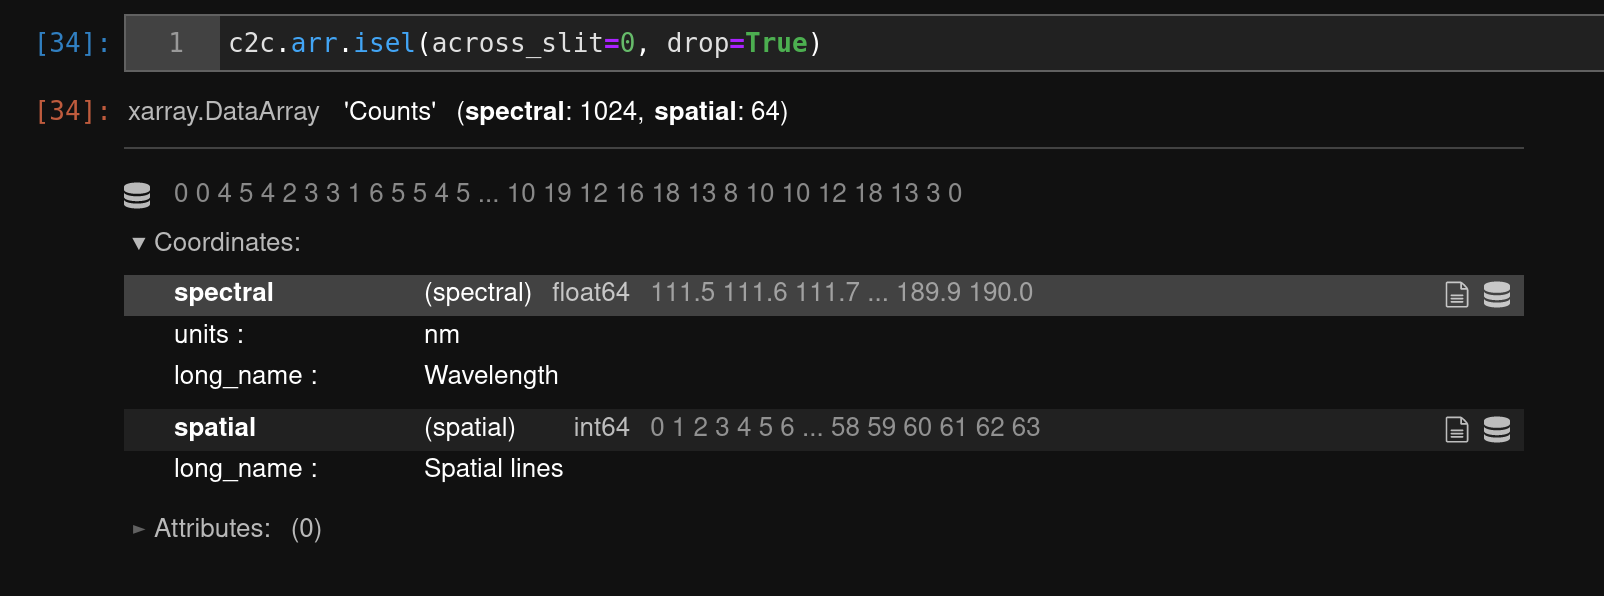
        arr = arr.rename({"dim_0": "spectral", "dim_1": "spatial", "dim_2": "samples"})
        arr = arr.assign_coords(
            {
                "spectral": self.wavelengths,
                "spatial": np.arange(*self.line_range),
                "samples": np.arange(self.n_integrations) + 1,
            }
        )
        arr.spectral.attrs["units"] = "nm"
        arr.spectral.attrs["long_name"] = "Wavelength"
        arr.spatial.attrs["long_name"] = "Spatial lines"
        arr.attrs["n_bands"] = self.n_bands
        arr.attrs["integration_duration"] = self.integration_duration
        arr.name = self.product_id
        return arr

will use “spectral” as y and spatial as x when not setting it:

Any takers? I’m still stumped.
If I do xarray.T nothing changes for hvplot default layout, so something else must determine it.

Can you print arr.dims / screenshot the print(arr)

Here you go. Interestingly the transpose inverts the arr.dims, but the image layout stays the same:

I suspect your dims has attrs set:

For example, lon here, axis: X, so no matter how you transpose, it’ll read that attrs.

import hvplot.xarray
import xarray as xr
import holoviews as hv
hv.extension("bokeh")

da = xr.tutorial.open_dataset("air_temperature").isel(time=0)["air"]

xr.DataArray(da.values, coords={"lat": da["lat"], "lon": da["lon"]}).hvplot()

print(da["lon"])
<xarray.DataArray 'lon' (lon: 53)>
array([200. , 202.5, 205. , 207.5, 210. , 212.5, 215. , 217.5, 220. , 222.5,
       225. , 227.5, 230. , 232.5, 235. , 237.5, 240. , 242.5, 245. , 247.5,
       250. , 252.5, 255. , 257.5, 260. , 262.5, 265. , 267.5, 270. , 272.5,
       275. , 277.5, 280. , 282.5, 285. , 287.5, 290. , 292.5, 295. , 297.5,
       300. , 302.5, 305. , 307.5, 310. , 312.5, 315. , 317.5, 320. , 322.5,
       325. , 327.5, 330. ], dtype=float32)
Coordinates:
  * lon      (lon) float32 200.0 202.5 205.0 207.5 ... 322.5 325.0 327.5 330.0
    time     datetime64[ns] 2013-01-01
Attributes:
    standard_name:  longitude
    long_name:      Longitude
    units:          degrees_east
    axis:           X
1 Like

Or maybe da.indexes:

1 Like

Yes, attrs are set, but no axis:

Yep, that’s it. And because dims was set to coords[::-1] in line 325, it’s the opposite from the obvious.
The use of attributes is a nice one, but I don’t think that’s documented anywhere? At least not on Gridded Data — hvPlot 0.7.2 documentation