I simply want to have a range slider that dynamically updates a 3 color colormap for a xarray quadmesh where the range slider takes the min and max values of the values of the variable plotted and on interaction with the range slider the filtering and colorbar of the hvplot is rerendered.
dss = fstd2nc.Buffer(file_path_list).to_xarray()
max_TT = dss.TT.max().data.compute()
min_TT = dss.TT.min().data.compute()
masked_dss = dss.TT.where((dss.TT < 10) & (dss.TT > min_TT))
masked_dss_2 = dss.TT.where((dss.TT > 10) & (dss.TT < 25))
masked_dss_3 = dss.TT.where((dss.TT > 25) & (dss.TT < max_TT))
hv1 = masked_dss.hvplot(
        cmap='greens', # Echelle de coulleurs
        colorbar=False,
        kind="quadmesh", # Type de graphique, dans notre cas important que ce soit quadmesh car on a une grille a des intervalle non reguliers
        rasterize=True, # Rasterize l'image pour une meilleur qualite et consistence
        data_aspect=1, # On assure de garder l'echelle des donnees eux-memes
        crs=ccrs.PlateCarree(), # On determine la projection des donnees
        projection=ccrs.PlateCarree(), # On projete les donnees sur n'importe laquelle des projections de Cartopy ex LambertConformal https://scitools.org.uk/cartopy/docs/v0.15/crs/projections.html
        project=True,
        geo=True,
        coastline=True,
        widget_location='bottom')
hv2 = masked_dss_2.hvplot(
        cmap='oranges', # Echelle de coulleurs
        colorbar=False,
        kind="quadmesh", # Type de graphique, dans notre cas important que ce soit quadmesh car on a une grille a des intervalle non reguliers
        rasterize=True, # Rasterize l'image pour une meilleur qualite et consistence
        data_aspect=1, # On assure de garder l'echelle des donnees eux-memes
        crs=ccrs.PlateCarree(), # On determine la projection des donnees
        projection=ccrs.PlateCarree(), # On projete les donnees sur n'importe laquelle des projections de Cartopy ex LambertConformal https://scitools.org.uk/cartopy/docs/v0.15/crs/projections.html
        project=True,
        geo=True,
        coastline=True,
        widget_location='bottom')
hv3 = masked_dss_3.hvplot(
        cmap='reds', # Echelle de coulleurs
        colorbar=False,
        kind="quadmesh", # Type de graphique, dans notre cas important que ce soit quadmesh car on a une grille a des intervalle non reguliers
        rasterize=True, # Rasterize l'image pour une meilleur qualite et consistence
        data_aspect=1, # On assure de garder l'echelle des donnees eux-memes
        crs=ccrs.PlateCarree(), # On determine la projection des donnees
        projection=ccrs.PlateCarree(), # On projete les donnees sur n'importe laquelle des projections de Cartopy ex LambertConformal https://scitools.org.uk/cartopy/docs/v0.15/crs/projections.html
        project=True,
        geo=True,
        coastline=True,
        widget_location='bottom')

hv1[0].object * hv2[0].object * hv3[0].object
which results in
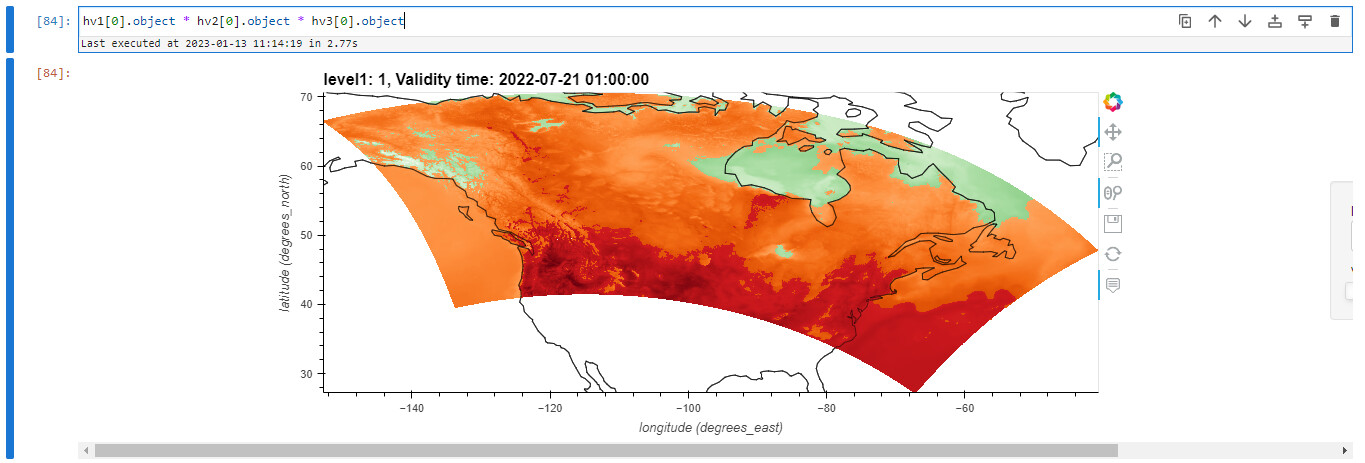
but all of this is very hacky
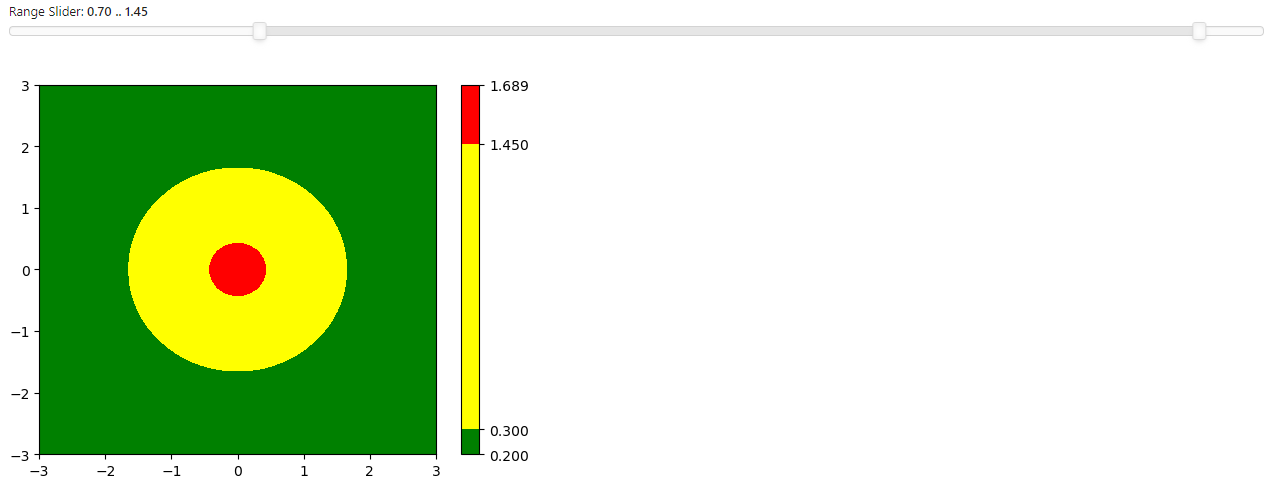
.object and having to specify the limits statically. Below I have made a little demo of what i would like to have but in MatPlotlib and a simple countour plot which bizarly does not update on range slider input that looks like
import numpy as np
import matplotlib.pyplot as plt
import matplotlib.colors as mc

range_slider = pn.widgets.RangeSlider(name='Range Slider', start=0.5, end=1.5, value=(0.3, 1.45), step=0.05)

def rs_print(rangeSlider):
    # print(rangeSlider)
    x,y = np.meshgrid(np.linspace(-3,3), np.linspace(-3,3))
    z = np.exp(-x**2-y**2)*1.5+0.2
    colors = ["green", "yellow", "red"]
    cmap= mc.ListedColormap(colors)
    boundaries=[z.min(),rangeSlider[0],rangeSlider[1], z.max()]
    # print(boundaries)
    m = plt.contourf(x, y, z, levels = boundaries, cmap=cmap)
    plt.colorbar(m, spacing="proportional")
    return m
pn.Column(range_slider, pn.bind(rs_print, rangeSlider=range_slider))
I would love to have the range slider for either a single color or colormaps (ideally) for one hvplot on the same dataset.