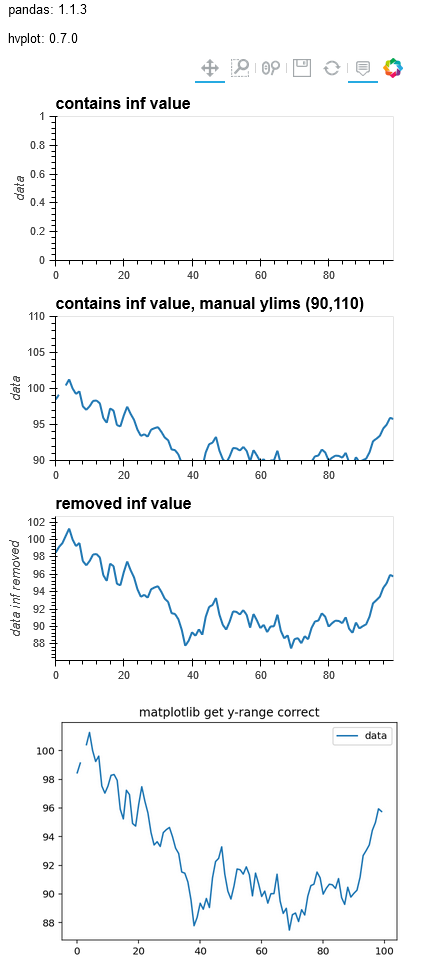
The y-range seems to be reset to (0,1) when there is an inf value in the data. The data is actually in the plot with the inf value is removed, but you only see an empty plotting window. pandas.plot seems to handle this better. Can anyone comfirm this bug?
df = pd.DataFrame(data=np.cumsum(np.random.normal(size=(100,1)))+100,columns=['data'])
df_inf = df.copy()
df_inf.iloc[2,:] = np.inf
%%capture
ax = df_inf.plot(y='data',title='matplotlib get y-range correct')
pn.Column((df_inf.hvplot(y='data',label='contains inf value') +
           df_inf.hvplot(y='data',label='contains inf value, manual ylims (90,110)').opts(ylim=(90,110)) +
           df.hvplot(y=[('data','data inf removed')],label='removed inf value')).opts(hv.opts.Curve(axiswise=True,width=400,height=200)).cols(1),
           ax.figure
         )