I am trying to utilize hvplot.explorer with custom formats for each selected column. Some columns are easily readable while others are in Scientific Notation (I don’t want).
How does one utilize bokeh’s HoverTool module to fix such a issue? Configuring plot tools — Bokeh 2.4.1 Documentation
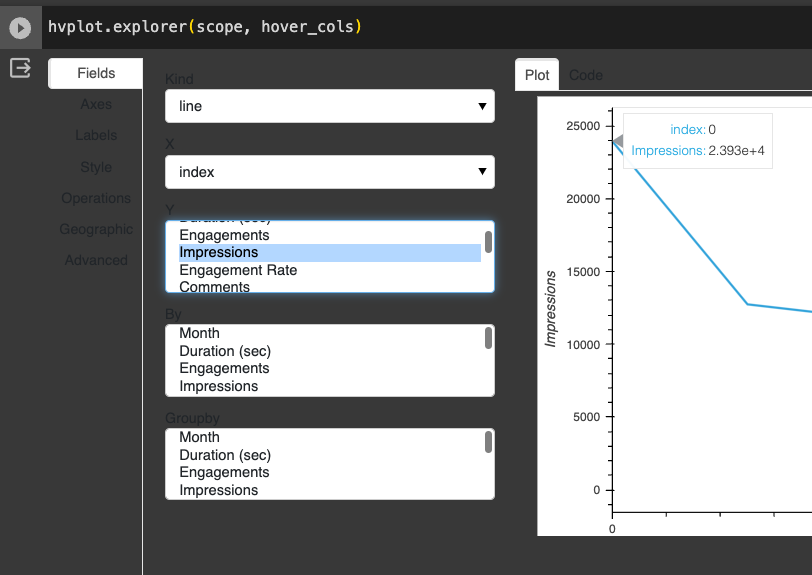
Here is a Minimal Reproducible Example of what I am after with Bokeh’s Hovertool to create custom formats for each selected column. In the following example, there is “Engagement Rate” which should be a %, while Impressions, which in the thousands should have a comma in the 3rd decimal place for readability purposes.
import hvplot.pandas
import numpy as np
import pandas as pd

from bokeh.models import HoverTool


# generation of random data
engagements = np.random.normal(50,10,12)
engagement_r8 = np.random.normal(2,0.30,12)
impressions = np.random.randint(1000, 1000000, 12)
months = range(1,13)

df = pd.DataFrame({'Month':months,
                   'Engagements':engagements,
                   'Engagement R8': engagements,
                   'Impressions':impressions})


hvplot.explorer(df)