I don’t think I have ever had something as frustrating as this case happen to me mostly because it is right before presenting it to others.
Basically, around 24 hours ago, the following line of code worked perfectly regardless of dataset size (usually between 100-2000 points).
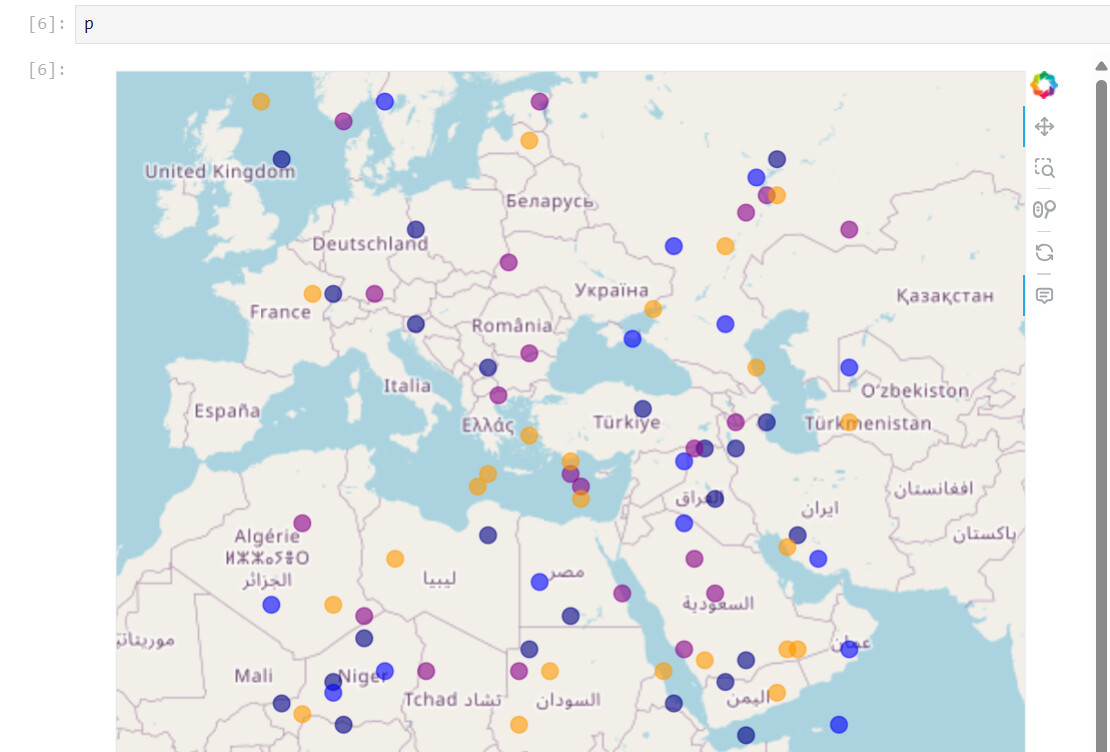
p = data.hvplot.points("longitude","latitude",c="flag",geo=True,tiles="OSM",
                                    cmap=["#000088","#0000FF","#880088","#FF9900"],alpha=0.6,
                                    xlim=x_coords,ylim=y_coords,
                                    yaxis=None,xaxis=None,s=144,legend="top",colorbar=False,
                                    height=600,width=700,max_width=700)
This was part of a much larger codebase that would plot this on a fully functional server.
After working fine with no issues for months, just today, without any warning, without upgrading any packages, changing any dependencies, I mean nothing, it now not only freezes my server (effectively crashing since even Ctrl+C doesn’t work via a terminal), it also breaks the rest of the applications on the same server, meaning the only correction is to shut down the server completely, and spin up a new one using panel serve.
I am simply baffled as to why this happens. I thought it would have been due to excessive data points, however when trying it out with less than 50 data points, I still get the same result. Any suggestions or ideas as to why this may be happening???