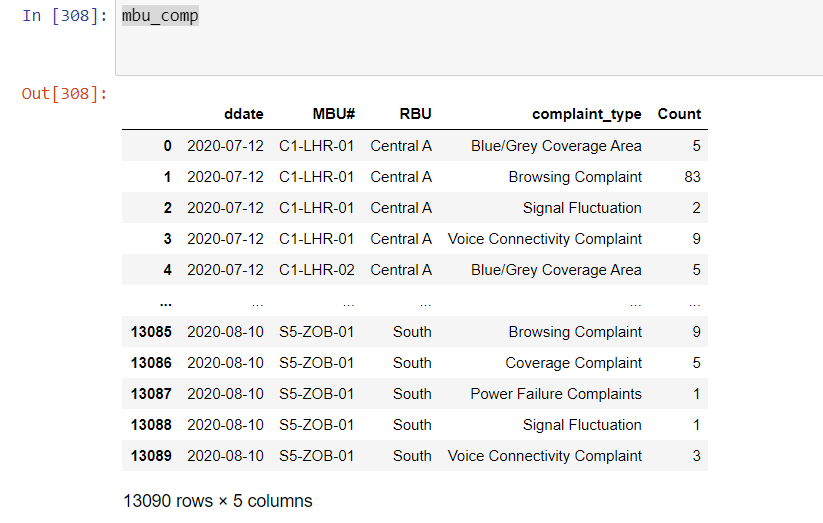
- I have a data frame in following format
-
Now i want to change the tooltips in MBU_heat with following code
from bokeh.models import HoverTool
from holoviews import opts
hover=HoverTool(tooltips=[(‘Date’, ‘@{ddate}{%F}’),(‘MBU’,’@{MBU#}’),(‘Count’,’@{Count}’)], formatters={’@{ddate}’: ‘datetime’})
opts.defaults(opts.HeatMap(toolbar=‘above’, tools=[‘hover’]))
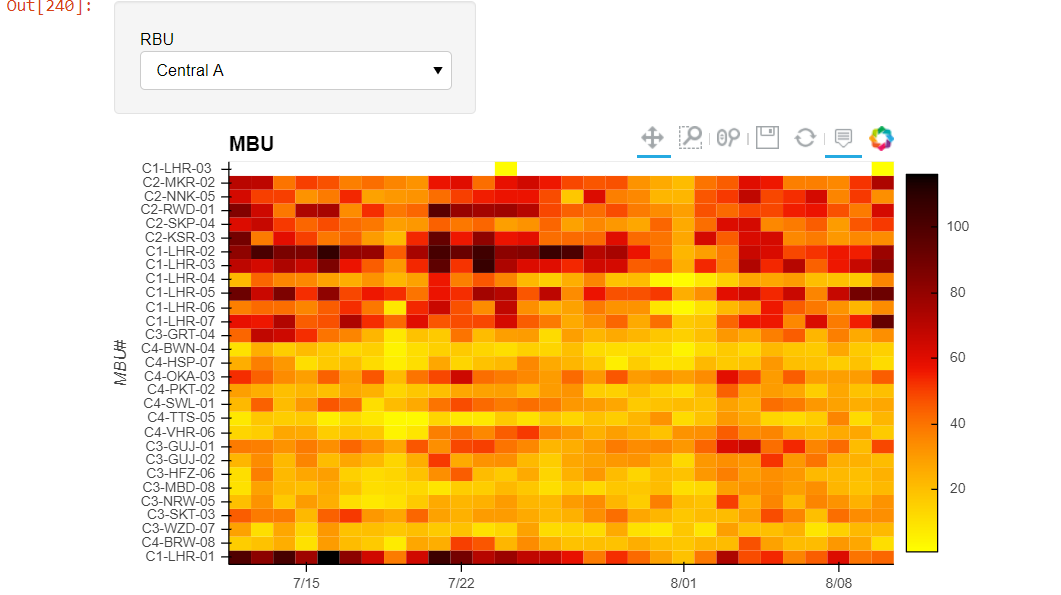
- Now i create a its heatmap with hvplot and groupby options with following code and output
MBU_heat=mbu_comp.hvplot.heatmap( title='MBU',x='ddate', y='MBU#', C='Count' ,reduce_function=np.sum ,groupby='RBU', widget_location='top_left',cmap=LSM_cmap,colorbar=True,height=400,width=700)
- Following are the status of MBU_heat
-
tooltip does not apply on the heatmap .
-
if I use via %opts or %% in notebook it works fine but i want to use in python program
-
Kindly guide how i apply and access opts tools tip in MBU_heat objects in python program
-
or how if can use %opts or %%opts in python program
I shall be very thankful
formating of the date not working in tooltip
Have you tried:
MBU_heat=mbu_comp.hvplot.heatmap( title='MBU',x='ddate', y='MBU#', C='Count' ,reduce_function=np.sum ,groupby='RBU', widget_location='top_left',cmap=LSM_cmap,colorbar=True,height=400,width=700).opts(tools=[hover])
?
Regarding the formatting. Sometimes hvplot screws up the variables, so maybe it got re-assigned to ‘x’:
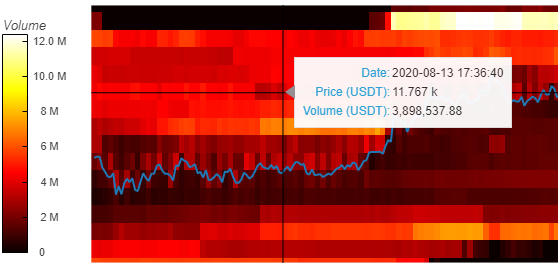
For me, hvplot of an xarray object resulted in me having to use the following tooltip, since my dimension names got reassigned:
tooltips = [
            ('Date', '$x'),
            (f'Price ({quote_currency})', '$y{'+f'{formatting}0'+' a}'),
            (f'Volume ({quote_currency})', '@image{0,0.00}')
        ]
hover = HoverTool(tooltips=tooltips)
BTW, a useful way to find out your current plot’s hover variables is this:
renderer = hv.renderer('bokeh')
renderer.get_plot(your_plot_object).handles['hover_tools']
Deleting the quotes around hover in this line should do the trick:
opts.defaults(opts.HeatMap(toolbar=‘above’, tools=[‘hover’]))
1 Like
It results to following error
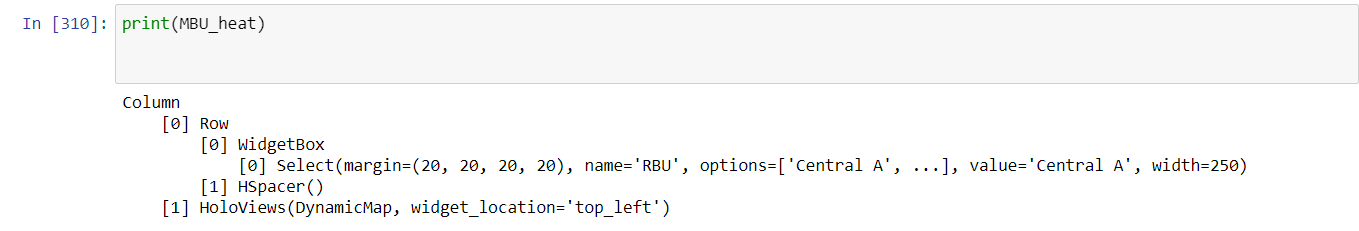
AttributeError: ‘Column’ object has no attribute ‘opts’
print(MBU_heat)
Column
[0] Row
[0] WidgetBox
[0] Select(margin=(20, 20, 20, 20), name=‘RBU’, options=[‘Central A’, …], value=‘Central A’, width=250)
[1] HSpacer()
[1] HoloViews(DynamicMap, widget_location=‘top_left’)
danmaty
11
@Material-Scientist
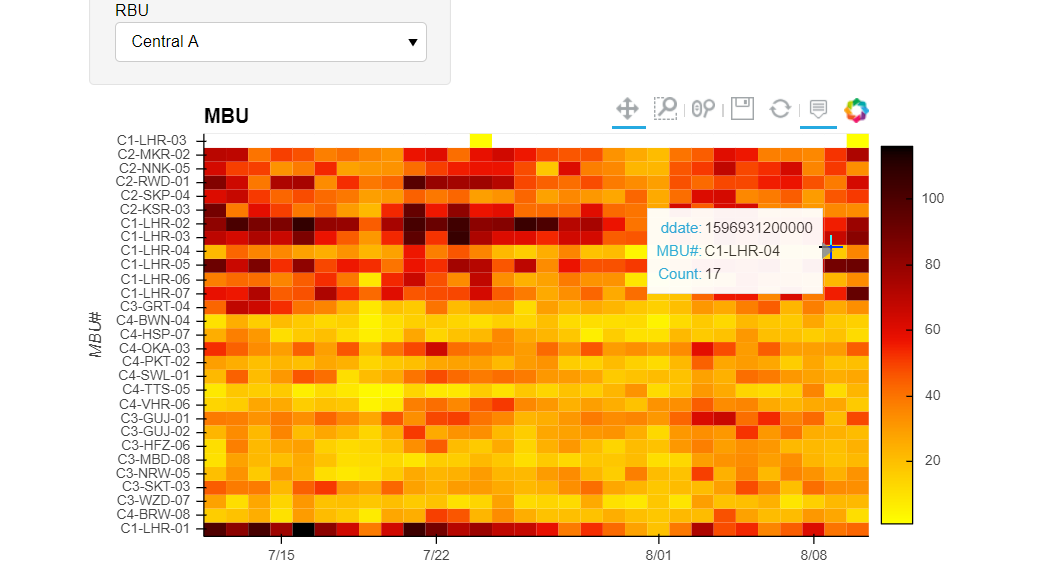
Unrelated question. How to set up a “crosshair” / pointer with long lines like in your screenshot?