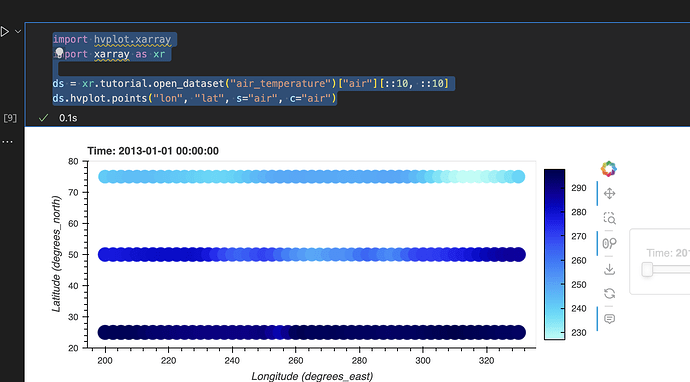
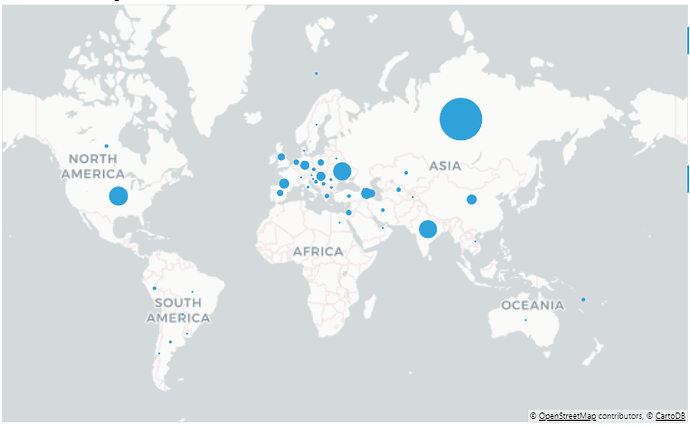
I have a map, and I’d like to be able to specify the size of the point (like a bubble chart) to correspond to another column in the df data frame, column name ‘count’. I tried using a .opts at the end of the points() call, but that gave me an error about mixing formats. It looks like there’s as size_index() parameter, and the docstring for it suggests that it’s deprecated in favor of size=dim(‘size’).
This block is working, but doesn’t try to change the size of the points:
plot = df[df['yr_month']==200101].hvplot.points("Longitude","Latitude",
                        geo=True, min_height=500,
                        tiles="CartoDark",
                        xaxis=None, yaxis=None, responsive=True,
                        title='Map')
I tried specifying vdims, as seems suggested by a holoviews docs here: https://holoviews.org/reference/elements/matplotlib/Points.html
This plot returns the following error:
WARNING:param.main: vdims option not found for points plot with bokeh; similar options include: []
plot = df[df['yr_month']==200101].hvplot.points("Longitude","Latitude", vdims=['count'],
                        geo=True, min_height=500,
                        tiles="CartoDark",
                        xaxis=None, yaxis=None, responsive=True,
                        title='Map')
I also tried this with adding an opts at the end, and got a ValueError: Unexpected option ‘size’ for Overlay type across all extensions. Similar options for current extension (‘bokeh’) are: [‘fontsize’].
plot = df[df['yr_month']==200101].hvplot.points("Longitude","Latitude", vdims=["count"],
                        geo=True, min_height=500,
                        tiles="CartoDark",
                        xaxis=None, yaxis=None, responsive=True,
                        title='Map').opts(size=dim('count')*20)
I’ve reached the end of my own troubleshooting capabilities, and I need some assistance to find the right option to adjust the glyph size to create a bubble chart overlaid on a map.

