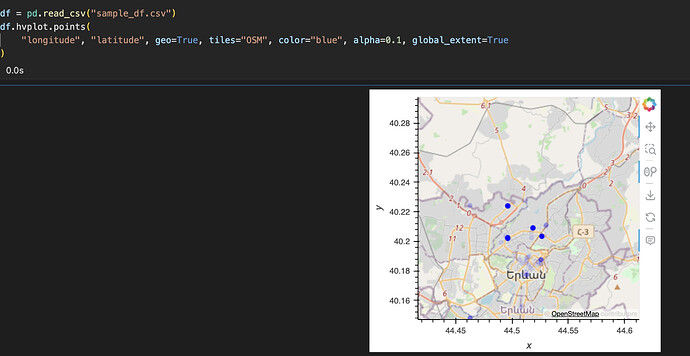
Hello all, so I have a simple pandas DataFrame with raw longitude and latitude values, and am simply trying to plot using hvplot’s API. All my code is the following:
import pandas as pd # edit
import geopandas as gpd # edit
import geoviews as gv # edit
df = load_some_dataset # edit / placeholder

df.hvplot.points('longitude','latitude',geo=True,tiles='OSM',color='blue',alpha='0.1')
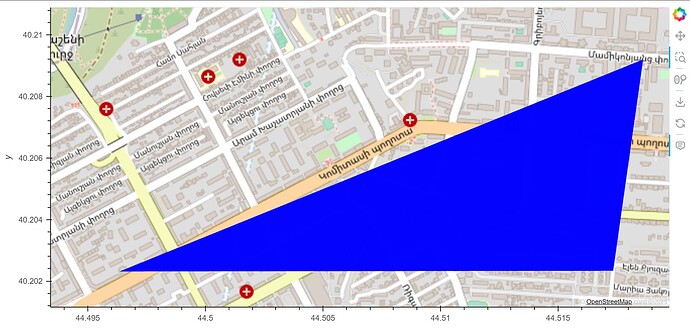
Instead of individual points on a random subset of my test dataset however, I get a triangle like the following:
which happens to encompass the points I am interested in but not show their individual location. How can I address this?
EDIT: The issue persists even if I manually build the same using GeoViews:
ds = gv.Dataset(df,kdims=["longitude","latitude"]).to(gv.Points,["longitude","latitude"],[])
tiles = gv.tile_sources.OSM

tiles * ds
or converting the dataframe to GeoPandas and then plotting, which still gives me this strange Triangle
gdf = gpd.GeoDataFrame(df, geometry=gpd.points_from_xy(df["longitude"],df["latitude"]))
gdf.hvplot.points(tiles=True,xlim=(44.47,44.55),ylim=(40.19,40.22))
EDIT 2: After further testing, this seems to only happen in a Jupyter notebook, but renders correctly when I launch a Panel server. The plot renders as a Bokeh one in Jupyter it just seems strange that a discrepancy exists.

