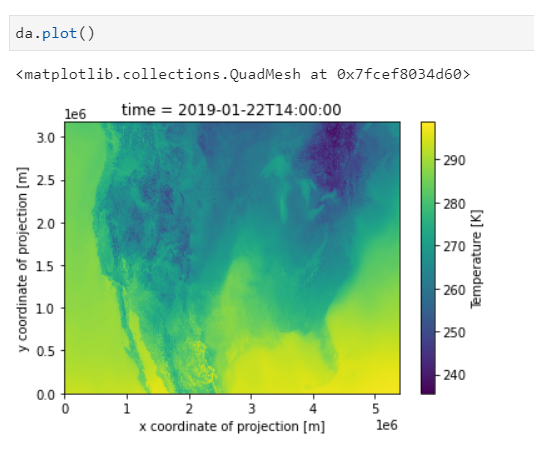
I’m getting very strange hvplot.xarray behavior when attempting to visualize a new Zarr dataset I created. I first thought something was wrong with the dataset, but the Matplotlib quadmesh da.plot() works fine:
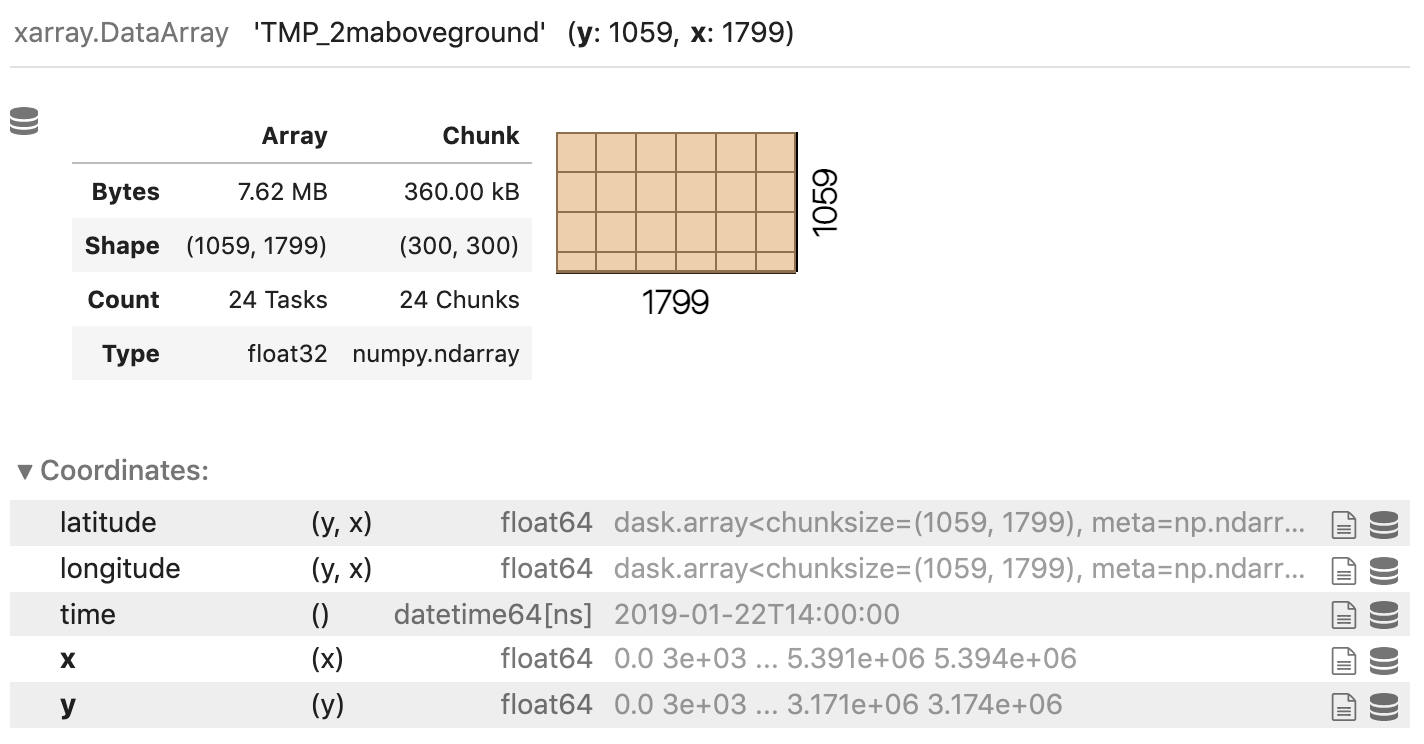
I extract a 2D DataArray from the dataset (and the 2D data has 300x300 size chunks).
Although the Matplotlib quadmesh da.plot() command works fine, attempting to use the quadmesh da.hvplot():
import xarray as xr
import hvplot.xarray
import fsspec

url = 's3://esip-qhub/noaa/HRRR/2019'
ds = xr.open_zarr(fsspec.get_mapper(url, requester_pays=True), consolidated=True)
da = ds.TMP_2maboveground.sel(time='2019-01-22 14:00')
da.hvplot()
gives the error:
ValueError: Object has inconsistent chunks along dimension y. This can be fixed by calling unify_chunks().
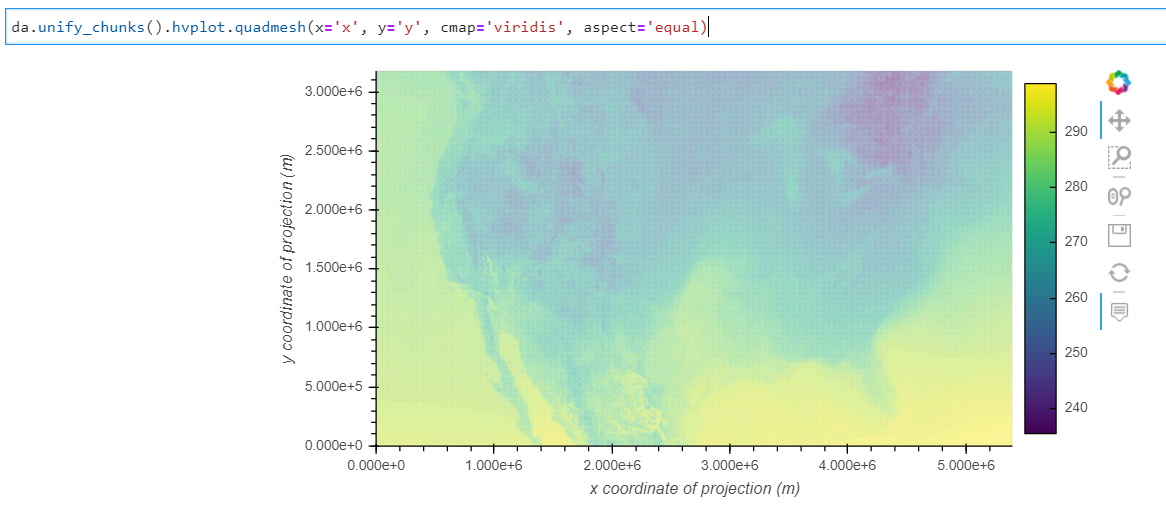
I can indeed get a plot by adding unify_chunks, but something clearly strange is going on:
And if I add the rasterize=True, it looks even stranger:
Here is the Full Notebook.
My versions are:
rsignell-usgs@jupyter-rsignell-2dusgs:~/shared/users/rsignell/HRRR$ conda list | grep -E --color 'geoviews|holoviews|bokeh|datashader|hvplot|xarray'
bokeh                     2.2.3            py38h578d9bd_0    conda-forge
datashader                0.12.0             pyhd3deb0d_0    conda-forge
geoviews                  1.8.2                      py_0    conda-forge
geoviews-core             1.8.2                      py_0    conda-forge
holoviews                 1.14.1             pyhd3deb0d_0    conda-forge
hvplot                    0.7.0              pyhd3deb0d_0    conda-forge
xarray                    0.16.2             pyhd8ed1ab_0    conda-forge
So after calling unify_chunks it actually behaves well for me at lest using the default image view:
Even the regular quadmesh rendering (da.unify_chunks().hvplot.quadmesh('x', 'y')) seems to work okay for me:
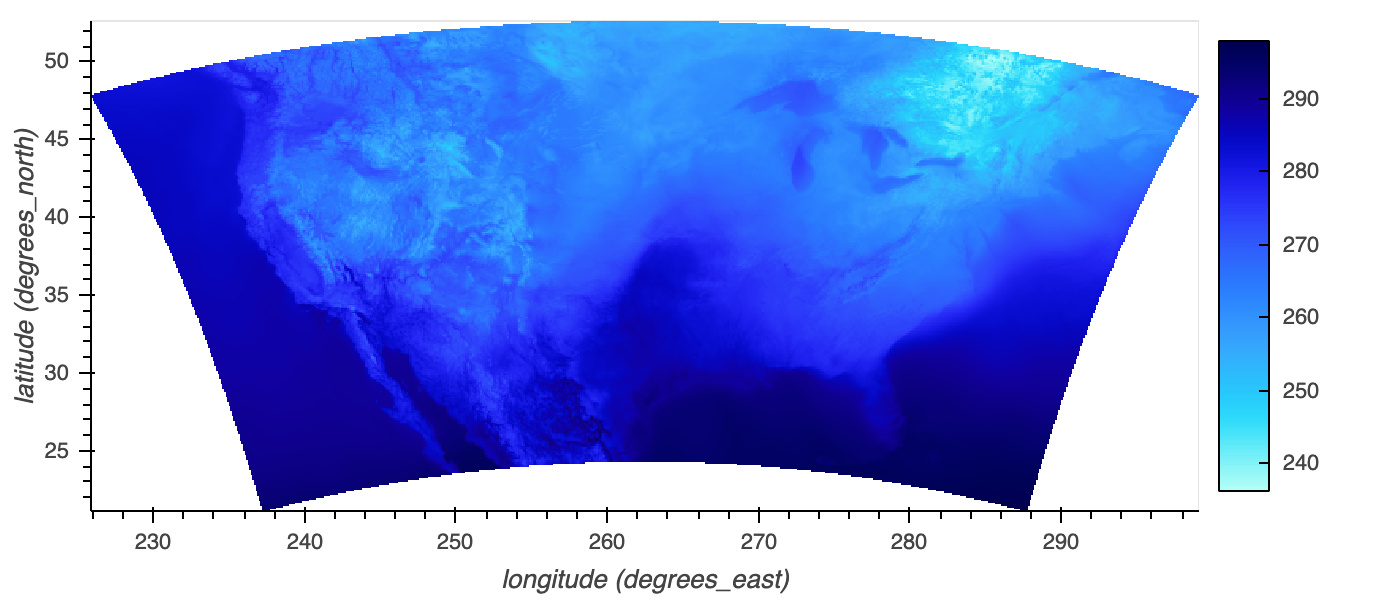
However as you rightly point out, something does appear off about the default datashader quadmesh rendering. However if you actually specify the ‘longitude’ and ‘latitude’ coordidnates with da.hvplot.quadmesh('longitude', 'latitude', rasterize=True) I get the following, seemingly correct, result:
So there seem like there are two issues here 1) it’s not correctly figuring out that it should be using the curvilinear coordinates by default, and 2) datashader is not rendering the mesh correctly with rectilinear coordidnates.
@rsignell So here is a question for you, in the end I checked and it absolutely needs the chunking to align (at least when the curvilinear coordinates are also chunked) because datashader will process each chunk of xs, ys and values together. In the curvilinear case (which you were invoking this is not needed though. So we could be smarter about when we try to access the chunks and if it determines they indeed needd to be unified we either raise the error early or let hvPlot just decide to call unify_chunks internally if needed. The latter could presumably could trigger a lot of unexpected computation.
@phillipfr, this is great, I can work with this by using x='longitude', y='latitude'.
I think I have an even more fundamental question: In what way are the chunks not aligned?
I didn’t look in detail but I assumed the value array chunks aren’t the same as the latitude/longitude chunks.
Ah, I see. Indeed, the longitude and latitude variables are not chunked.
Does look like they are chunked to me with very different chunk sizes than the value array.
I would expect it to work fine if they weren’t.
Ah sorry, it’s not really “chunked”, just a single chunk.
So the lesson learned here is: to avoid needing “align_chunks”, you should chunk your coordinate variables the same way you chunk your data variables.
This dataset was created by rechunking 1000s of NetCDF files into a Zarr dataset using Rechunker, and I created a chunk plan only for the 3D data variables, not the 2D lon,lat coordinate variables. We learn best through failure! 
Thanks @philippjfr for the education!