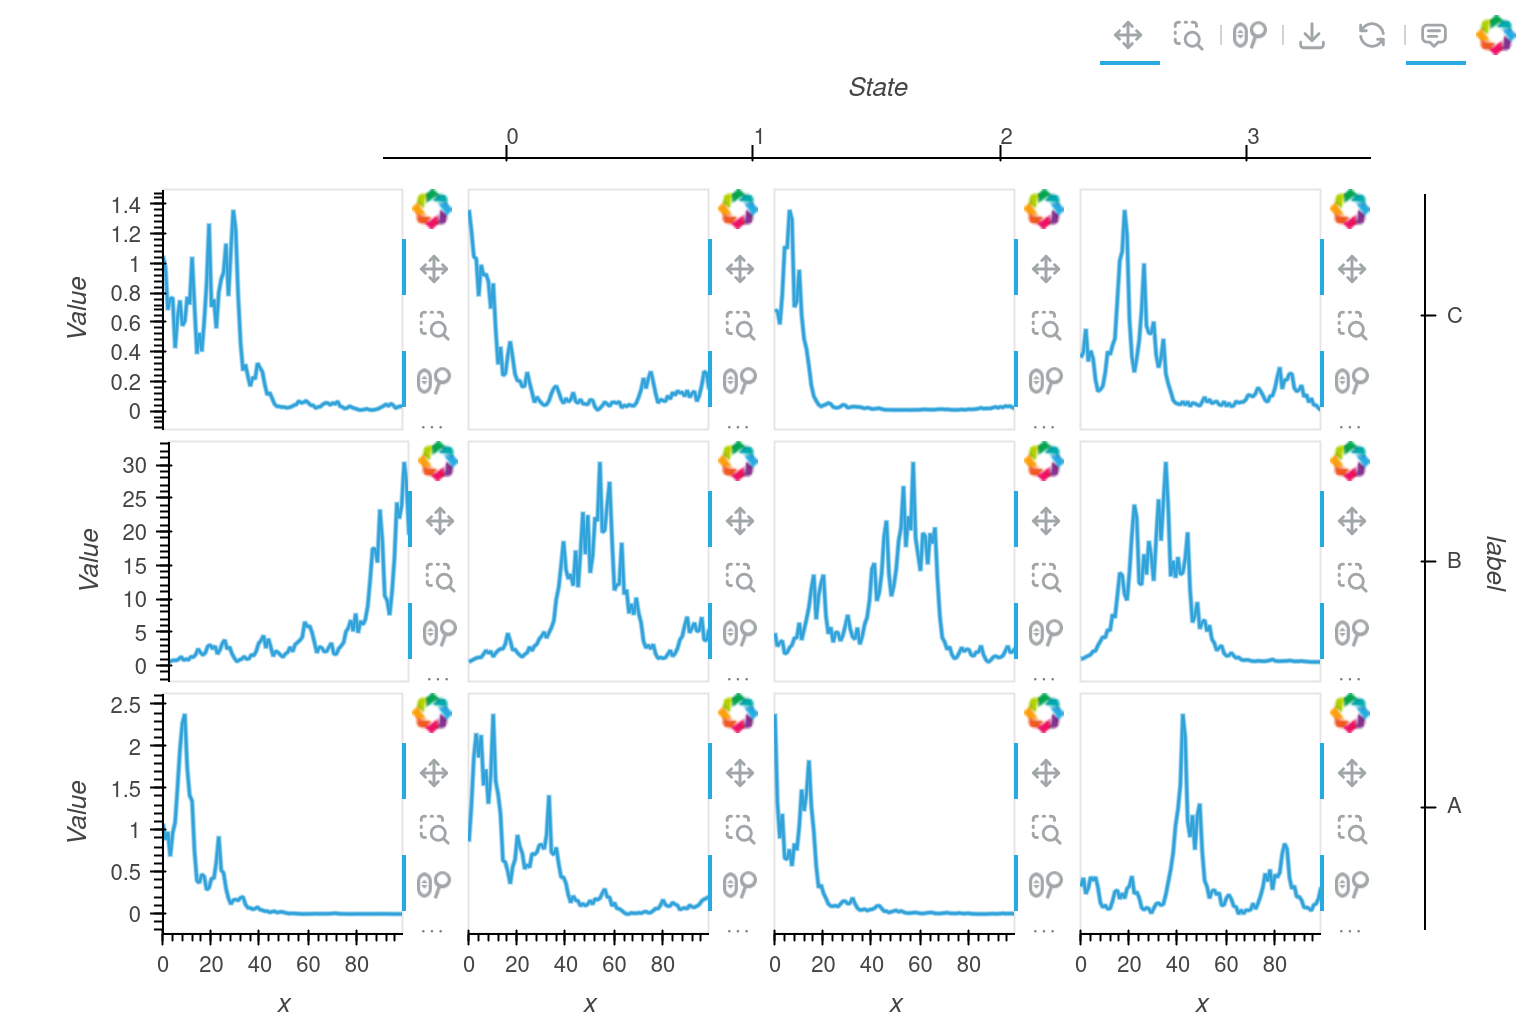
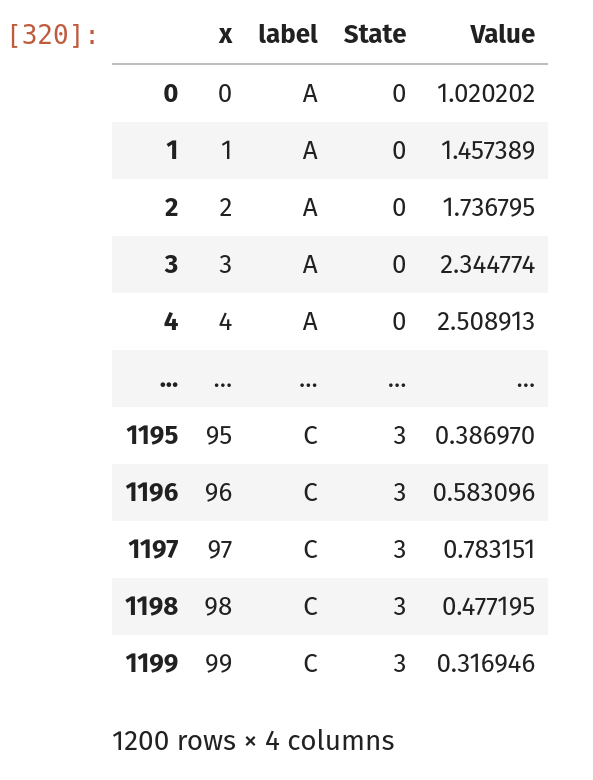
I’m working with simulation data. Each simulation runs 100 timesteps. I have run simulation A, B, and C. I’m tracking 4 states of my system per timestep per simulation.
I have the following:
import numpy as np
import pandas as pd

labels = list('ABC')
states = 4
xs = 100

df = pd.DataFrame({'x': len(labels)*states*list(range(xs)), 'label': [l for l in labels for _ in range(states*xs)], 'State': len(labels)*[s for s in list(range(states)) for _ in range(xs)], 'Value': 0.52+np.random.rand(len(labels)*states*xs)})

df['Value'] = df.groupby(['label', 'State']).cumprod()['Value']

df
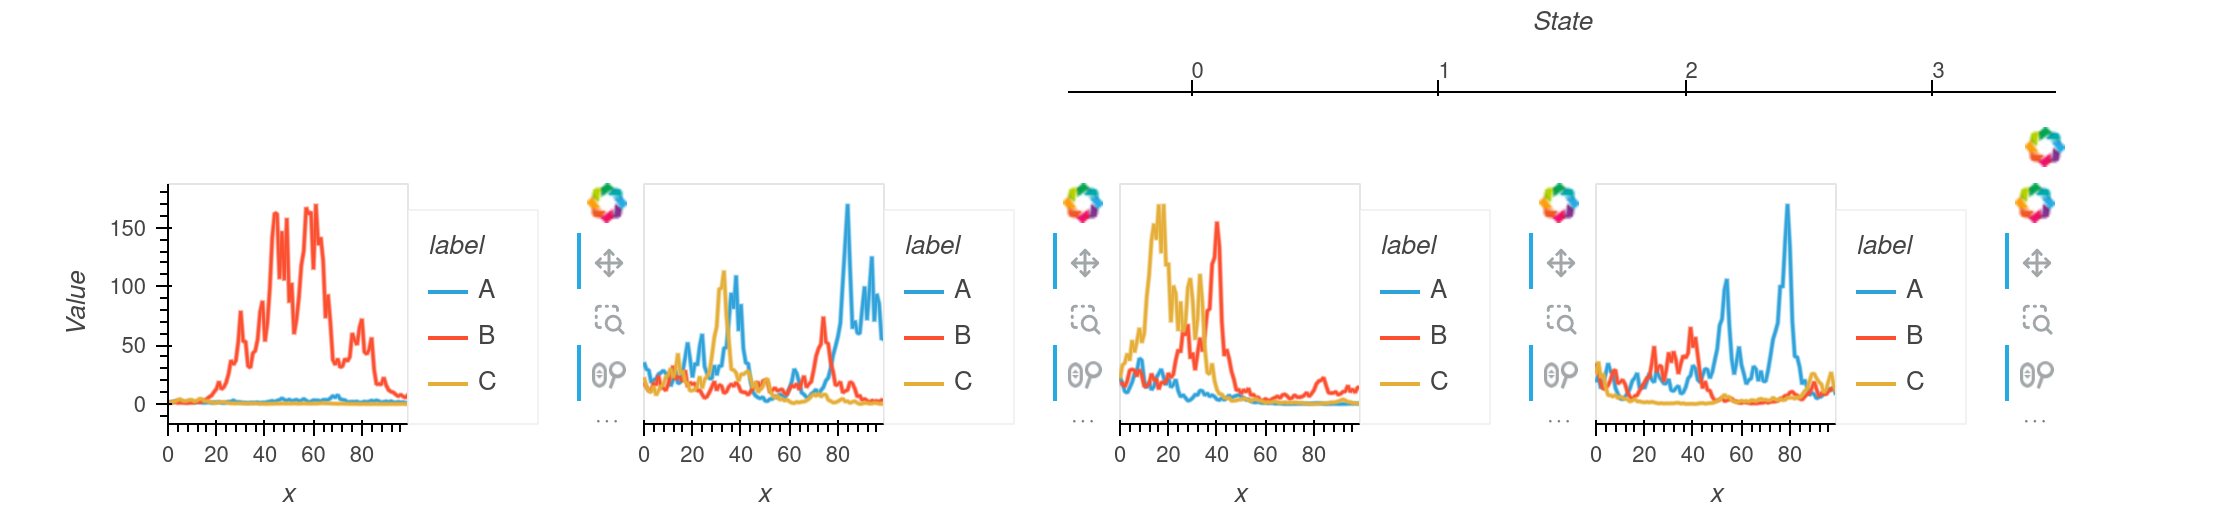
I would like to see the charts by label, with rows over State. But I’m getting columns instead of rows.
df.hvplot(x='x', y='Value', row='State', by='label', shared_axes=False)
Looks pretty clearly like a bug. So i’ll go ahead and open an issue on hvplot as well.
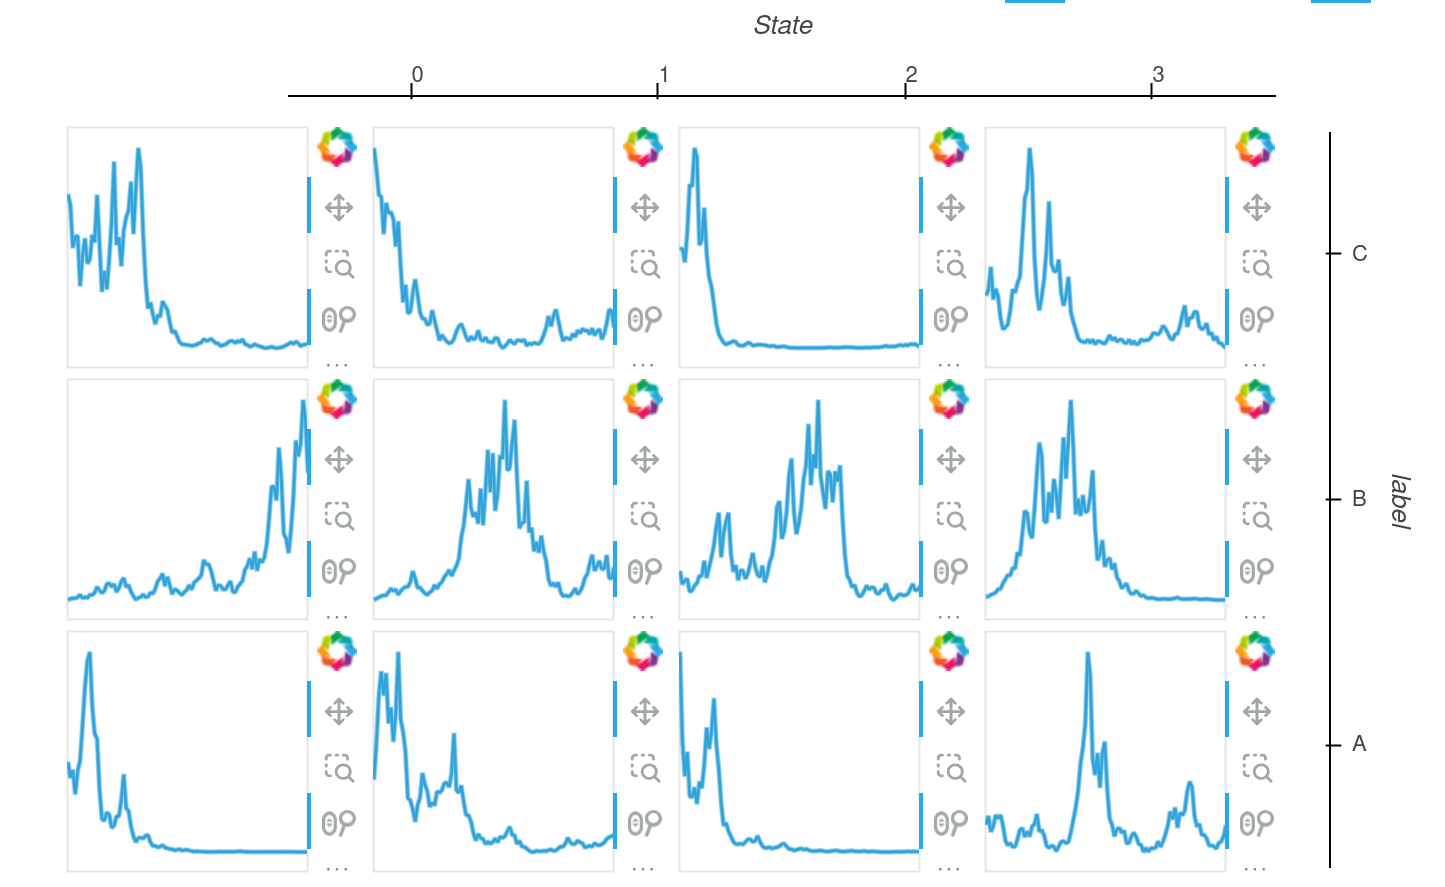
Also why is there no y-axis on the plots after the first one? And why is there no ‘State: X’ title for the plots as seen here: Subplots — hvPlot 0.9.0 documentation
I tried things like:
Settings .cols(1)
df.hvplot(x='x', y='Value', row='State', by='label', shared_axes=False).cols(1)
KeyError: "Dimension 'State' not found."
Setting subplots=True
df.hvplot(x='x', y='Value', row='State', by='label', shared_axes=False, subplots=True)
Cannot plot nested Layouts.

:GridSpace   [State]
   :NdLayout   [label]
      :Curve   [days_passed]   (Value)