The following code produces a faulty html file where the last step shows the second to last entry instead of the last entry in the time series.
import xarray as xr
import hvplot.xarray  # noqa

air_ds = xr.tutorial.open_dataset('air_temperature').load()
air = air_ds.air
hvp=air.isel(time=slice(0,4)).hvplot(groupby='time', width=600)
hvp

hvplot.save(hvp,'test.html',fmt='scrubber',fps=2)
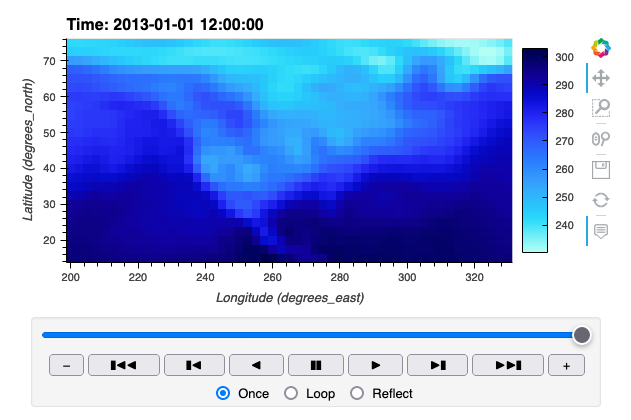
What is expected in the html file is the 18:00:00 time step in the last step. Instead, the 12:00:00 step is repeated.
hvplot version 0.7.3
xr version 0.20.2