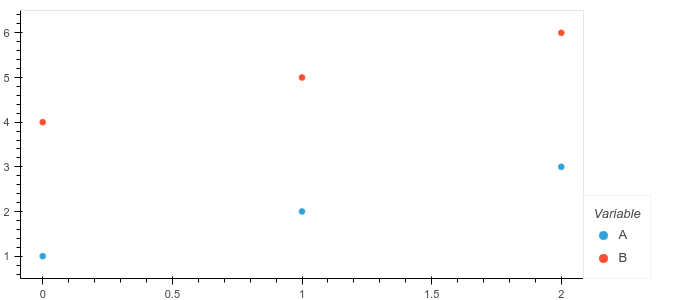
I’m looking to mute one of the series in the scatter plot
temp = pd.DataFrame({'A':[1,2,3],'B':[4,5,6]})
fig = temp.hvplot.scatter(muted_alpha=0.1, hover_cols=['symbols'])
fig
However, hvplot.scatter does not seem to have a muted option.
fig['A'].opts(muted=True)
gives me
ValueError: Unexpected option 'muted' for Scatter type across all extensions. Similar options for current extension ('bokeh') are: ['muted_alpha', 'muted_color'].
and the listed options does not contain muted
hvplot.help('scatter', docstring=False, generic=False)
Style options
-------------

alpha
angle
cmap
color
fill_alpha
fill_color
hover_alpha
hover_color
hover_fill_alpha
hover_fill_color
hover_line_alpha
hover_line_color
line_alpha
line_cap
line_color
line_dash
line_join
line_width
marker
muted_alpha
muted_color
muted_fill_alpha
muted_fill_color
muted_line_alpha
muted_line_color
nonselection_alpha
nonselection_color
nonselection_fill_alpha
nonselection_fill_color
nonselection_line_alpha
nonselection_line_color
palette
selection_alpha
selection_color
selection_fill_alpha
selection_fill_color
selection_line_alpha
selection_line_color
size
visible
But other plot types (say hvplot.line) does have muted.
Is this by design?
Are there ways to mute the series in a scatter plot?