An hvplot area plot that is composed of steps instead of lines would be an incredible feature.
It would make a plot like the following much more aesthetic and also much more accurate and practical.
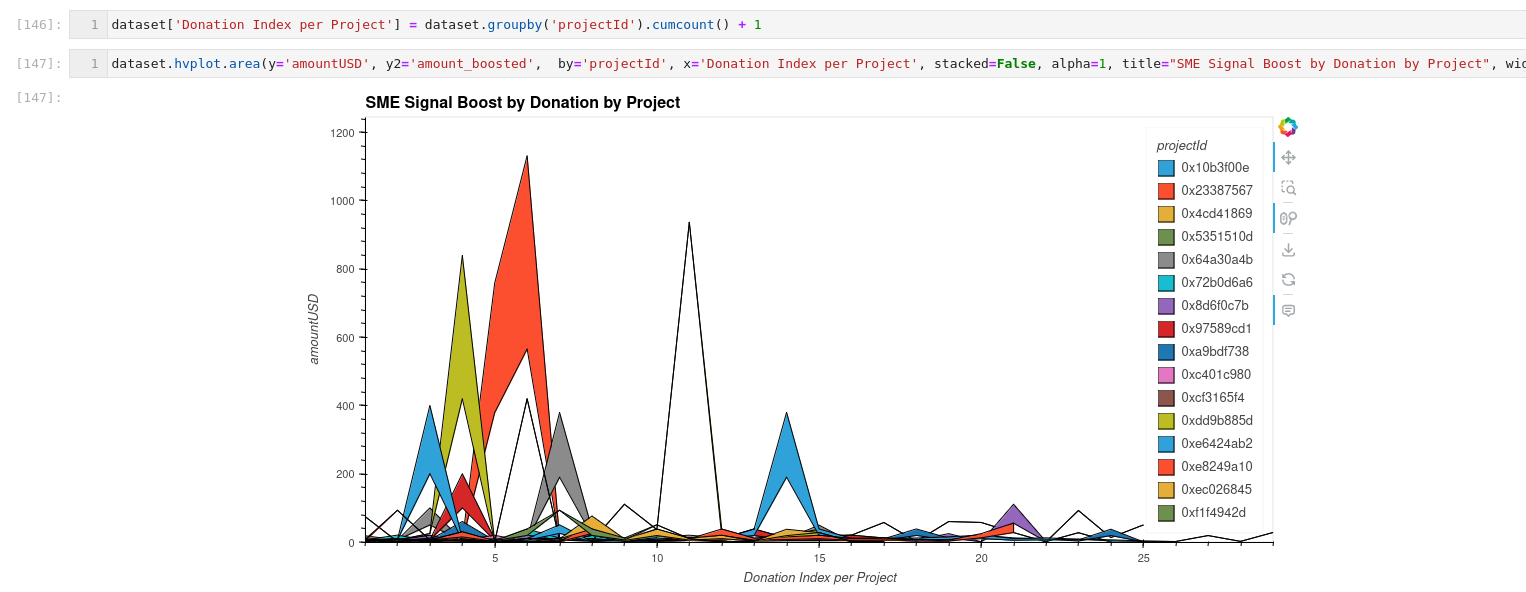
Any thoughts?
An hvplot area plot that is composed of steps instead of lines would be an incredible feature.
It would make a plot like the following much more aesthetic and also much more accurate and practical.
Any thoughts?
I believe it could be achieved with pandas reindex and ffill method, but I haven’t tested yet.
According to chatgpt it’s achievable by using holoviews. Would be nice to have directly in the hvplot api.
import numpy as np
import pandas as pd
import holoviews as hv

# Sample data
df = pd.DataFrame({
    'x': [0, 1, 2, 3, 4],
    'y': [0, 1, 0, 2, 0]
})

# Create a Curve with step interpolation
curve = hv.Curve(df, 'x', 'y').opts(interpolation='steps-mid')

# Create an Area plot under the curve
area = hv.Area(df, 'x', 'y')

# Combine the curve and area
step_area = (curve * area).opts(width=400, height=300)

step_area
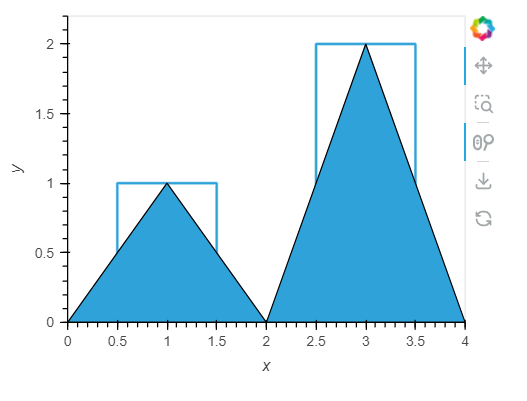
Hi @LinuxIsCool
How would ChatGPT explain that it looks like below? ![]()
import numpy as np
import pandas as pd
import holoviews as hv
import panel as pn

pn.extension()
hv.extension("bokeh")

# Sample data
df = pd.DataFrame({
    'x': [0, 1, 2, 3, 4],
    'y': [0, 1, 0, 2, 0]
})

# Create a Curve with step interpolation
curve = hv.Curve(df, 'x', 'y').opts(interpolation='steps-mid')

# Create an Area plot under the curve
area = hv.Area(df, 'x', 'y')

# Combine the curve and area
step_area = (curve * area).opts(width=400, height=300)


pn.panel(step_area).servable()