I’m replicating one of the geo-examples (Geographic Data — hvPlot 0.8.0 documentation) that also uses datashader (rasterize=True). Using the same dataset (rasm) it takes 1-2 minutes to render the image with a 6-core CPU and 64 GB RAM, so this is already surprising and I’m wondering if it’s normal? I expected this to be much faster.
Additionally, I replicate the example with a different (bigger) dataset (size: 1 x 22179 x 26838) and it takes several minutes to render. The memory usage also goes through the roof, averaging 32 GB for a long time and reaching 52 GB.
The file loaded has a 2.5 GB size on disk and is rendered immediately in QGIS, without considerable amount of memory usage.
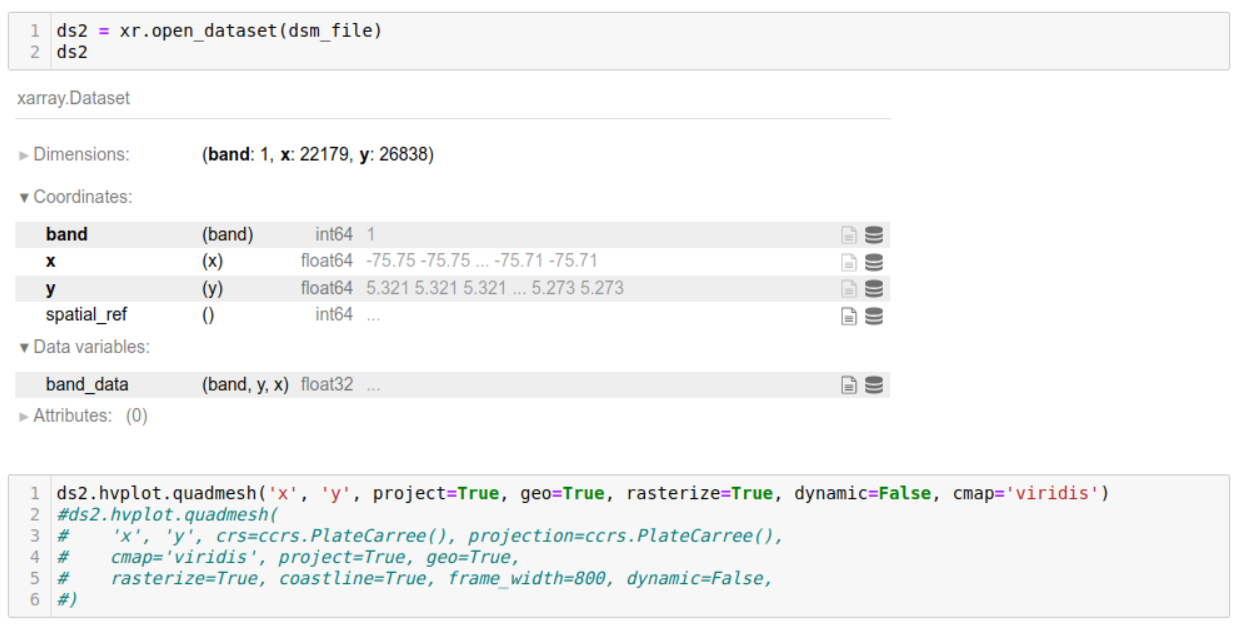
See the code and the dataset metadata in the screenshot.
Welcome to the community! Sorry that you haven’t received a reply here yet. From the hvplot example, the step below takes a bit over a minute to render on my M1 mac with 10 cores and no memory spike.
Not really! But I am surprised that it is this slow and suspect it should be faster.
On my dev machine it takes ~60 s to render, but if I remove the reprojection arguments it takes only 6 s. So it probably isn’t the datashader code that is slow (although there are different code paths for Cartesian and curvilinear coordinates) but is more likely to be the reprojection.
Note that the number of cores is not relevant here, only a single core is used. If the xr.Dataset used a dask array rather than a numpy array then the datashader code would run on multiple cores, but I don’t know about the reprojection code as I am not familiar with that.