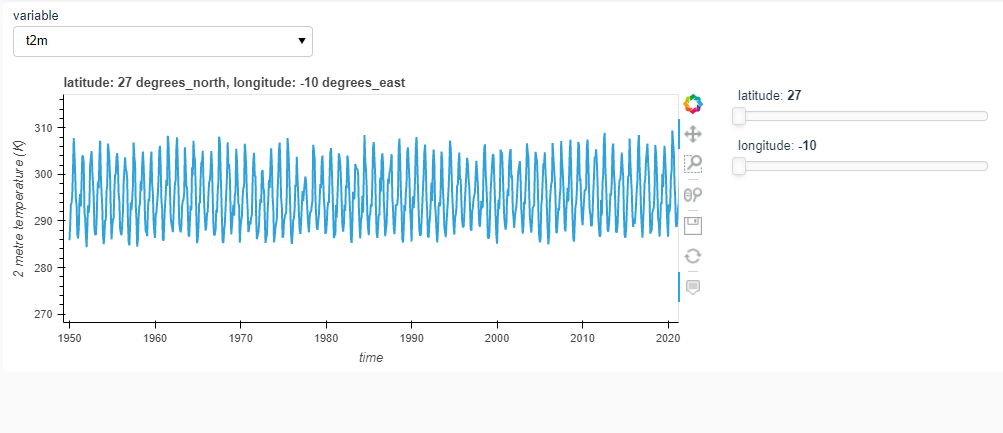
Hey guys , im working on a django project for visulisation of netcdf data , i use hvplot to plot the data and there is no interactivity , i want to know if possible how to make it possible .
the code :
import hvplot
import hvplot.xarray
import xarray as xr
import holoviews as hv
import panel as pn
from panel.interact import interact
import numpy as np

from bokeh.plotting import figure
from bokeh.embed import components
from bokeh.layouts import column, grid
from bokeh.models import ColumnDataSource, CustomJS, Slider,HoverTool
hv.extension('bokeh')


def data_visualization(request):

      ds = xr.open_dataset('T_mensuel.nc')


      def plot(variable):
           return ds[variable].hvplot.line()

      model = interact(plot, variable = list(ds.data_vars))

      script, div = components(model.get_root())


      return render(request,'visualization.html',{'script': script, 'div': div})